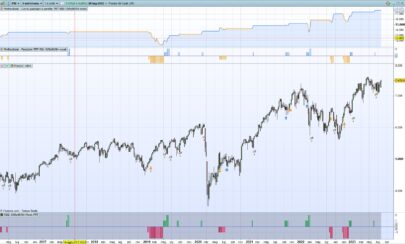
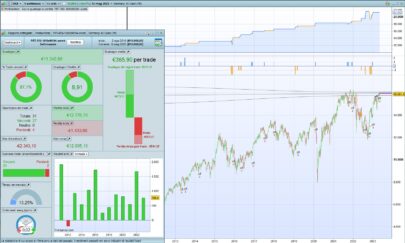
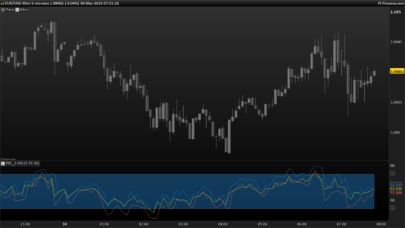
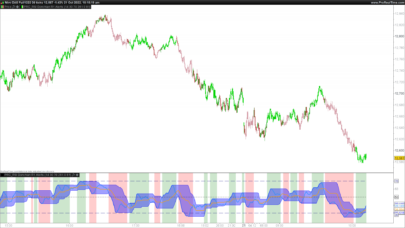
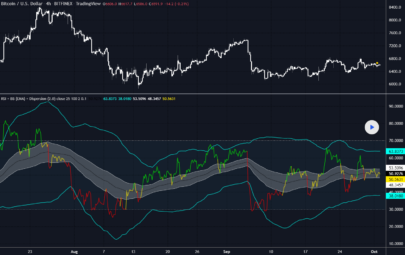
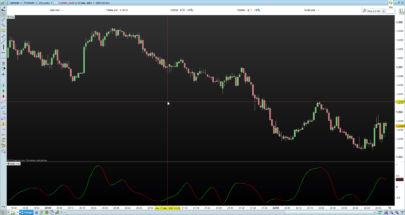
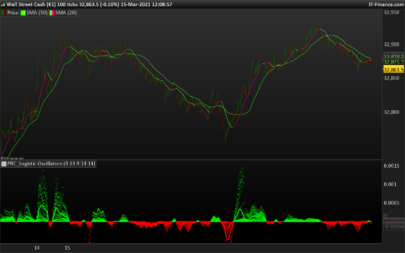
The Slow Relative Strength Index, SRSI, is a concept made by Vitali Apirine that appear in the TASC (Technical Analysis of Stocks & Commodities) magazine, in April 2015.
This momentum oscillator is derivated from the famous J. Welles Wilder RSI formula. The change of price movements are measured relatively to an exponential moving average movements. The returning values are bounded between 0 and 100.
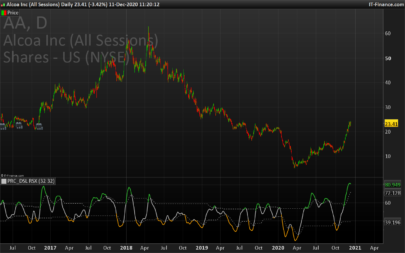
The SRSI can be used for trend following by using its momentum effect but also to detect oversold and overbought zones of price. It tends to be more effective on trending instrument because when price remainin an upper trend, the oscillator remain also in the overbought zone more longer than an original RSI. I attached a screenshot of the original RSI compared the SRSI.
|
1 2 3 4 5 6 7 8 9 10 11 12 13 14 15 16 17 18 19 20 21 22 23 24 25 26 |
//parameters : // N = 6 // X = 14 Price = exponentialaverage[X](close) SF = 1 / N Change = Price-Price[1] if barindex <= N+X THEN NetChgAvg = (Price - Price[N]) / N TotChgAvg = average[N](ABS(Price-Price[1])) ELSE NetChgAvg = NetChgAvg[1] + SF * (Change-NetChgAvg[1]) TotChgAvg = TotChgAvg[1] + SF * (ABS(Change)-TotChgAvg[1]) ENDIF if TotChgAvg <> 0 THEN ChgRatio = NetChgAvg / TotChgAvg ELSE ChgRatio = 0 ENDIF SRSI = 50 * (ChgRatio + 1) RETURN SRSI, 50 as "50 level", 20 as "20 level", 80 as "80 level" |
Share this
No information on this site is investment advice or a solicitation to buy or sell any financial instrument. Past performance is not indicative of future results. Trading may expose you to risk of loss greater than your deposits and is only suitable for experienced investors who have sufficient financial means to bear such risk.
ProRealTime ITF files and other attachments :PRC is also on YouTube, subscribe to our channel for exclusive content and tutorials


