1. Introduction
The Smart Money Concepts (SMC) indicator is an advanced tool in technical analysis designed to identify the movements of “smart money” in financial markets. This indicator is based on the theory that major market participants, such as financial institutions, leave traces in price behavior that retail traders can exploit. SMC focuses on market structures, key inflection points, and liquidity zones, providing a detailed view of the underlying dynamics driving price movements.
2. How the SMC Indicator Works
The Smart Money Concepts (SMC) is based on the idea that major market participants, known as “smart money,” can move the market in predictable ways. These movements manifest in specific patterns and price structures that SMC seeks to identify and use to predict future price movements. The SMC indicator comprises several key components and techniques, detailed below:
2.1. Market Structures
The SMC indicator identifies and marks market phases through the analysis of significant highs and lows. These phases include:
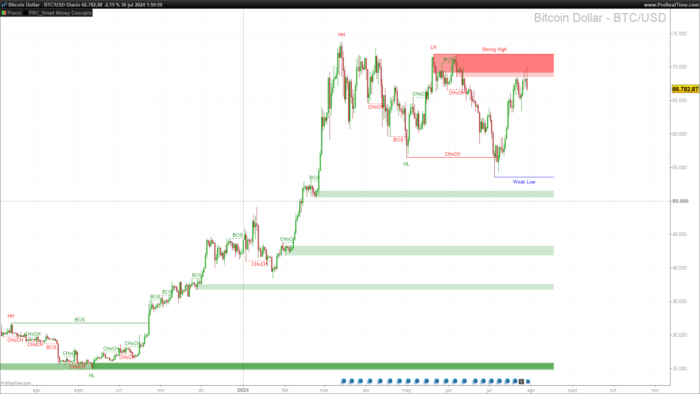
- Uptrend: Characterized by higher highs and higher lows. SMC marks these levels using labels like “Higher High” (HH) and “Higher Low” (HL).
- Downtrend: Identified by lower highs and lower lows. The labels used are “Lower High” (LH) and “Lower Low” (LL).
- Accumulation and Distribution Phases: These are lateral phases where major players accumulate or distribute assets before a significant directional move.
2.2. Change of Character (CHoCH) and Break of Structure (BOS)
The indicator detects changes in the market structure by identifying CHoCH (Change of Character) and BOS (Break of Structure). These events occur when:
- CHoCH: Indicates a potential trend change. It occurs when the price breaks a significant level in the opposite direction of the current trend, suggesting a possible transition from an uptrend to a downtrend, or vice versa.
- BOS: Marks a break in the current market structure that confirms the continuation of the prevailing trend. For example, in an uptrend, a BOS occurs when the price surpasses a previous high, thus confirming the strength of the upward trend.
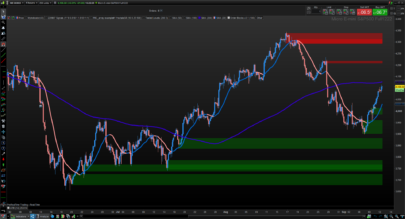
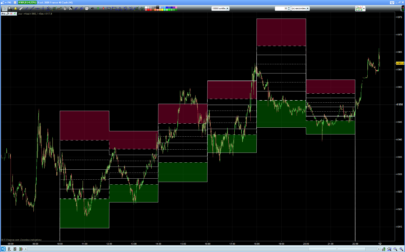
2.3. Institutional Orders and Order Blocks
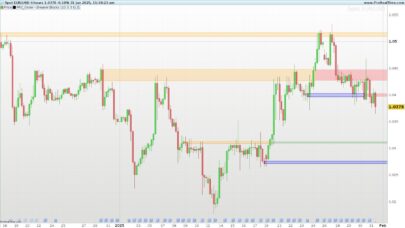
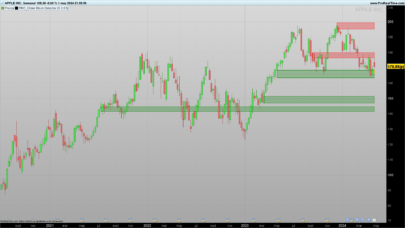
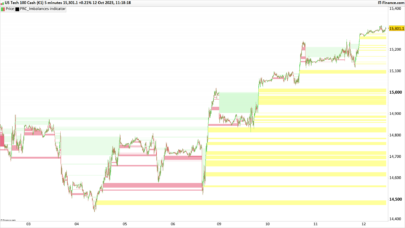
Order blocks are areas where institutions place large orders that can halt or reverse price movement. SMC identifies these blocks using filters based on the Cumulative Mean Range or the ATR (Average True Range) to determine high-probability areas where the price might react.
- Internal Order Blocks: Identified within the market structure and indicative of areas where prices may find support or resistance.
- Structural Order Blocks: Larger and more significant, these blocks are usually associated with broader market movements and major trend changes.
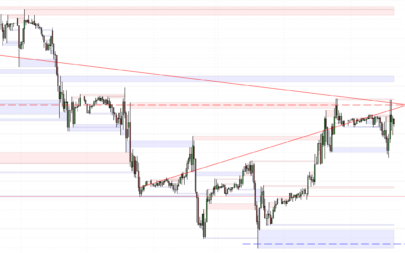
2.4. Liquidity Zones and Confluence
Liquidity zones are areas where stop-loss or take-profit orders accumulate. SMC identifies these areas to signal potential reversal zones. Additionally, the concept of confluence is used to validate signals when multiple factors converge in the same area, increasing the likelihood of a price reaction.
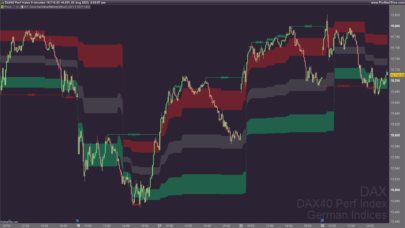
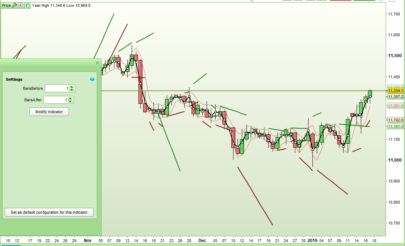
2.5. Visual Representation
SMC uses visual elements such as lines, rectangles, and text on the chart to represent these structures and key zones. For example, trend lines, order zones, and labels like “BOS” or “CHoCH” can be drawn to facilitate the identification of trading opportunities.
3. Indicator Configuration
The Smart Money Concepts (SMC) is highly customizable, allowing users to adjust several parameters to tailor the indicator to their specific needs and trading styles. Below are the main parameters and how they can be configured:
3.1. Main Parameters
length: Defines the number of bars used to identify pivots. A higher value smooths out the identification of pivots, while a lower value detects more recent pivots.showswings: Allows enabling or disabling the visualization of market swings. A value of1shows the swings, while0hides them.showHLswings: Activates the visualization of significant highs and lows in the swings (HH, HL, LL, LH). This parameter is useful for clearly visualizing market structure.showinternals: Controls the visualization of internal structures such as CHoCH and BOS on smaller time frames.showibullandshowibear: Allow adjusting the display of bullish and bearish internal structures, respectively. Possible values are:1: Shows all structures.2: Shows only BOS.3: Shows only CHoCH.
3.2. Filters and Order Blocks
ifilterConfluence: Filters signals according to the confluence of different factors. It is useful for avoiding false signals and increasing the indicator’s accuracy.obFilter: Defines the method for identifying order blocks. A value of1uses the ATR as a filter, while0uses the Cumulative Mean Range. This setting allows adjusting the precision level in detecting these key areas.showOBandshowiOB: Control the visualization of structural and internal order blocks, respectively. These parameters can be adjusted to show only the most recent order blocks or those that have not yet been violated by the price.showlastOB: Sets the number of order blocks to display on the chart, useful for keeping the chart clean and focused only on the most relevant zones.
3.3. Visual Options
The indicator allows for extensive visual customization, such as the use of colors and line styles to differentiate between bullish and bearish structures, as well as between order blocks and other key areas.
4. Practical Application
The Smart Money Concepts (SMC) can be applied in various market scenarios to identify trading opportunities. Below are some examples of how to use the indicator in common situations:
4.1. Bullish Trend Scenario
In a market with a clear uptrend, SMC can help identify optimal buying zones by:
- Identifying Bullish Order Blocks: Using the ATR or Cumulative Mean Range filter, areas where institutions are likely buying can be identified. These zones often act as support.
- Confirming Trend Continuation: The detection of a bullish BOS or CHoCH can signal the start or continuation of the uptrend. These structures indicate points where “smart money” might be entering the market.
Practical Example:
- A trader might wait for the price to return to an unbroken bullish order block before entering a long position. Additional confirmation could come from a bullish CHoCH, indicating a trend change.
4.2. Bearish Trend Scenario
In a bearish market, SMC is useful for identifying areas where institutional selling might occur:
- Detecting Bearish Order Blocks: Like in a bullish market, these blocks identify areas where the price is likely to find resistance.
- Confirming Trend Continuation: Bearish BOS or CHoCH confirm the presence of a downtrend and can be used to identify entry points for short positions.
Practical Example:
- A trader might look for short entry signals when the price touches a bearish order block, followed by a bearish BOS, suggesting trend continuation.
4.3. Sideways Market Scenario
In sideways markets, SMC can be used to identify reversal points and consolidation zones:
- Recognizing Range Structures: SMC helps delineate the boundaries of a consolidation range, identifying key highs and lows.
- Detecting False Breakouts: In these scenarios, CHoCH can be particularly useful for identifying false breakouts and potential reversals within the range.
Practical Example:
- A trader could use SMC to enter long positions near the support of the range and short positions near the resistance, especially if these levels coincide with order blocks or liquidity zones identified by the indicator.
5. Advantages and Limitations
The Smart Money Concepts (SMC) is a robust and versatile indicator offering multiple benefits to traders, but it also has certain limitations that should be considered.
5.1. Advantages
- Detection of Institutional Movements:
- SMC is designed to identify areas where major market participants have likely placed significant orders, helping traders follow the “smart money” flow.
- Flexibility and Customization:
- Numerous customizable parameters allow users to tailor the indicator to different trading styles and timeframes, from scalping to long-term trading.
- Identification of Market Structures:
- The indicator provides a clear view of market structures such as trends, ranges, and reversals, facilitating decision-making based on the current market structure.
- Use in Various Market Scenarios:
- SMC is applicable in bullish, bearish, and sideways markets, providing a versatile tool for traders.
- Clear Visualization:
- Visual elements like lines, order blocks, and BOS/CHoCH labels help clearly visualize key areas on the chart, improving analysis interpretation.
5.2. Limitations
- Dependency on Configuration:
- The effectiveness of SMC can depend on the correct setup of its parameters. Inadequate adjustments can result in false signals or missed trading opportunities.
- Requires Advanced Knowledge:
- While powerful, SMC can be complex to interpret for novice traders. Understanding the concepts of BOS, CHoCH, and order blocks requires a solid foundation in technical analysis.
- Sensitivity to Market Noise:
- In lower timeframes, SMC can be sensitive to market noise, leading to false signals. It is important to use it in combination with other confirmation tools.
- No Guarantee of Success:
- Like any technical analysis tool, SMC does not guarantee successful outcomes. Market movements can be unpredictable, and there is always the risk of losses.
- Requires Constant Updates:
- Financial markets are dynamic, and trading strategies need to adapt to changing conditions. SMC parameters may require frequent adjustments to remain effective.
6. Conclusion
The Smart Money Concepts (SMC) indicator is a sophisticated tool designed to help traders identify and follow the movements of major market participants. By focusing on key market structures such as CHoCH, BOS, and order blocks, SMC provides a detailed view of underlying price dynamics. Its ability to adapt to various trading styles and timeframes, along with its clear visual representation, makes it a valuable addition to any technical analysis toolkit. However, as with any indicator, it is crucial to use SMC as part of a comprehensive trading strategy, always considering inherent limitations and complementing it with other forms of analysis.
Share this
No information on this site is investment advice or a solicitation to buy or sell any financial instrument. Past performance is not indicative of future results. Trading may expose you to risk of loss greater than your deposits and is only suitable for experienced investors who have sufficient financial means to bear such risk.
ProRealTime ITF files and other attachments :
Find other exclusive trading pro-tools on ![]()
PRC is also on YouTube, subscribe to our channel for exclusive content and tutorials

Thanks Ivan. Would u pls help to write a stratagy using all smartness in this indicator?
Merci Ivan pour le travail et le partage. Malheureusement, je n’arrive pas à installer correctement l’indicateur. Lorsque je veux ajouter l’indicateur au graphique, un message d’erreur apparait. ” Erreur deans l’indicateur : PRC_Smart Money Concepts (50 t t t t t t 5 t t) Ligne 1 : Erreur : commande inconnue.
Si quelqu’un a une solution. Apres avoir chercher, la commande ligne 1 semble ok. Ainsi que pour les variables aussi…
Merci!
Hola, ¿estás bien? Quería saber si tienes habilidades en el lenguaje de programación NT8 ? ¿Porque me gustaría traducir un indicador a NT8 que se parezca al suyo? Pero es más sencillo.
Hola. Lo siento, sólo trabajo con traducciones de otro lenguaje a PRT
hi Ivan
When the order block color changes from bright red to Yellow what that means for the indicator if you can explain that please
many thanks
That means the close is between the top and bottom level of an order block. Check lines 464 and 483.
hi Ivan is it possible to include FAIR VALUE GAP code in to this indicator
Bonjour. Il y a une erreur dans le programme “ligne1 : Erreur : commande inconnue”
As tu une explication?
Sans doute parce que tu utilises le mauvais éditeur de code, il s’agit d’un indicateur. Je recommande plutôt de télécharger le fichier itf et de l’importer dans la plateforme, cela évitant ce genre d’erreur..
Hi Ivan, thank you for this indicator. Is it possible to include the volume of buys and sells in the order block? Is there anyway to tell which order block is stronger than the other? Thanks
J’ai la même erreur sur ligne 1 avec une importation dans les règles de l’art. Comment faire?
Cela est probablement dû au fait que vous avez une ancienne version de l’outillage.
Vérifiez le code et vous verrez plusieurs lignes avec fillcolor().
Modifiez ces lignes en supprimant fillcolor() et en remplaçant coloured(“green”,0) par coloured(“green”). idem pour le reste des couleurs.
Hola Iván, intento crear un proscreener automático con este indicador al igual que se puede hacer con cualquier otro indicador del catálogo de prorealtime pero no me deja o no sé hacerlo, ¿existe alguna posibilidad de poder hacer un proscreener con las opciones STRONG HIGH o STRONG LOW?, gracias por tu gran trabajo.
Hola. Sí se puede, tendrás que hacerlo programando. Así, eliminando toda la parte de código innecesaria (que no se utilice en el screener) te dará los resultados deseados. También tendrás que eliminar los comandos de dibujo.
Thank you Ivan, great job
Would it be possible to add in the sript the possibility of connecting by a drawsegment the HH,HL,LL,LH ( Showswings) to better see the structure
Thank you