







Smooth Price Oscillator (SPO)
1. Introduction
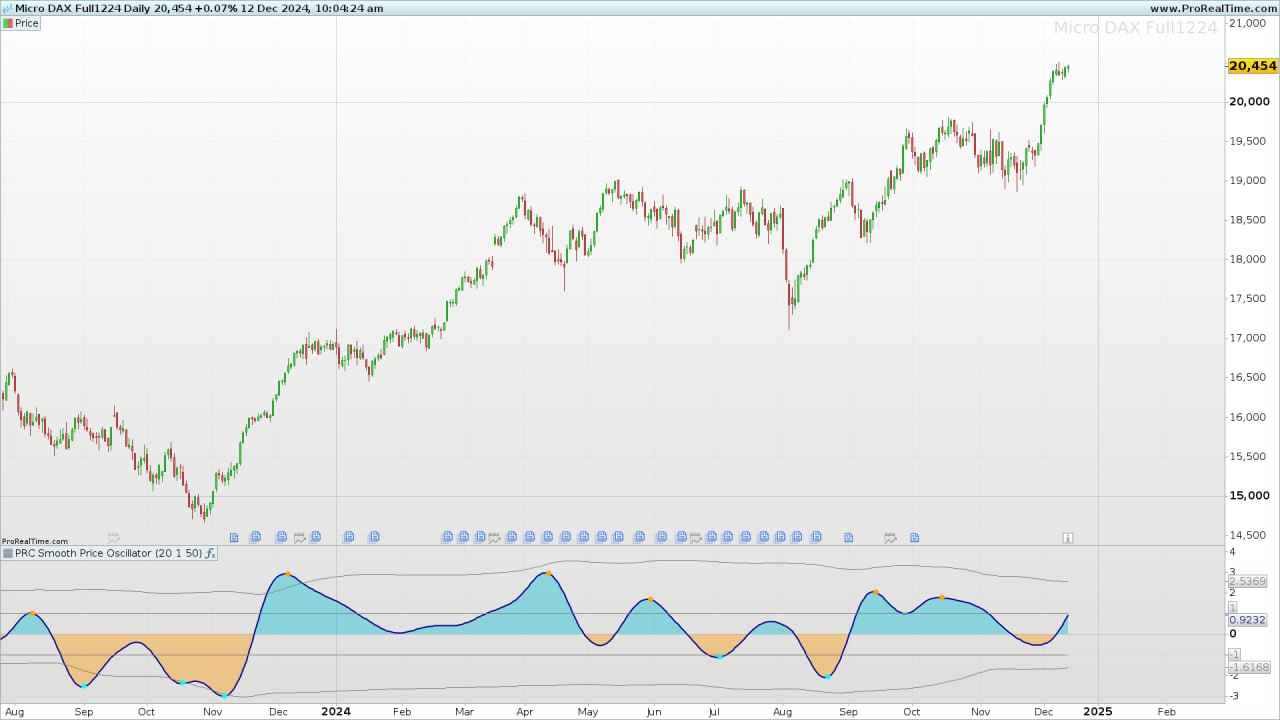
The Smooth Price Oscillator (SPO) is a technical indicator designed to smooth and normalize price variations within a defined range. Unlike traditional oscillators, the SPO applies advanced smoothing and standard deviation techniques to provide clearer signals, less prone to market noise.
The primary goal of the SPO is to help traders identify reversal points and confirm trends with greater precision. This makes it an ideal tool for those seeking a balance between sensitivity and reliability in their chart analysis.
2. Fundamentals of the SPO
The SPO combines two smoothed price lines: one long and one short. These lines are derived from mathematical techniques based on exponential smoothing to eliminate market noise. The difference between these lines generates the central oscillator.
One of the most notable features of the SPO is the normalization of the oscillator using its standard deviation, along with the inclusion of deviation bands. This simplifies visual interpretation by providing dynamic upper and lower bounds.
In summary, the SPO is based on:
- Smoothing price data.
- Normalization using standard deviation.
- Creating dynamic bands to frame the oscillator.
3. Calculating the SPO
The calculation of the Smooth Price Oscillator is done in several steps:
- Smoothed long line: Calculated using a longer smoothing period to represent long-term market trends.
- Smoothed short line: Uses a shorter period to capture more immediate movements.
- Oscillator: Obtained as the difference between the short and long lines.
- Normalization: The oscillator value is divided by its maximum observed standard deviation over a defined period.
- Upper and lower bands: Calculated using the mean and standard deviation of the normalized oscillator, creating a visual framework to assess extremes.
4. Interpretation and Usage
The SPO provides several ways to interpret data and make trading decisions:
- Identifying reversal points:
- Crosses of the oscillator with the upper or lower threshold (positive or negative).
- Signals generated when the oscillator changes direction within the bands.
- Confirming trends:
- Normalized oscillator staying at extreme values (positive or negative) for a prolonged period.
- Alignment with other indicators like moving averages or RSI.
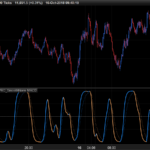
The oscillator colors provide intuitive visual guidance:
- Blue shades for positive values.
- Orange shades for negative values.
5. Configuring the SPO in ProRealTime
The SPO allows adjustment of several parameters to suit different trading styles and markets:
- Smoothing length (
lenSmooth): Controls the smoothing period for the long and short lines. - Threshold (
threshold): Defines the key overbought or oversold levels for generating signals. - Standard deviation length (
lenStd): Determines the period used to calculate the oscillator’s standard deviation.
Configuration Tips:
- For intraday trading strategies, use lower values for
lenSmoothto capture quick movements. - For long-term strategies, increase
lenSmoothto avoid false signals. - Adjust the
thresholdto match the volatility of the asset being analyzed.
6. Conclusion
The Smooth Price Oscillator is a versatile tool that balances sensitivity and reliability in technical analysis. Its ability to filter market noise and provide clear signals makes it ideal for both novice and experienced traders.
Advantages:
- Noise reduction through advanced smoothing.
- Easy visualization with colors and dynamic bands.
- Applicable to multiple time horizons and trading styles.
Limitations:
- May react with delays in highly volatile markets.
- Requires appropriate parameter adjustment based on market context.
The SPO is particularly useful in trending markets or assets with predictable movements, offering clear and visually appealing signals for more efficient decision-making.
7. ProBuilder Code
//-------------------------------------------------//
//PRC Smooth Price Oscillator
//version = 0
//26.11.2024
//Iván González @ www.prorealcode.com
//Sharing ProRealTime knowledge
//-------------------------------------------------//
// inputs
//-------------------------------------------------//
lenSmooth=20
threshold=1
lenStd=50
pi=3.1416
//-------------------------------------------------//
// Smoothed Line Long Calculation
//-------------------------------------------------//
periodL=2*Lensmooth
stepL=2*pi/periodL
a1L=exp(-sqrt(2)*pi/periodL)
b1L=2*a1L*cos((sqrt(2)*stepL/periodL)*180/pi)
c2L=b1L
c3L=-a1L*a1L
c1L=1-c2L-c3L

if barindex<4 then
LineLong=close
else
LineLong=c1L*(close+close[1])/2+c2L*LineLong[1]+c3L*LineLong[2]
endif
//-------------------------------------------------//
// Smoothed Line Short Calculation
//-------------------------------------------------//
periodS=Lensmooth
stepS=2*pi/periodS
a1S=exp(-sqrt(2)*pi/periodS)
b1S=2*a1S*cos((sqrt(2)*stepL/periodS)*180/pi)
c2S=b1S
c3S=-a1S*a1S
c1S=1-c2S-c3S

if barindex<4 then
LineShort=close
else
LineShort=c1S*(close+close[1])/2+c2S*LineShort[1]+c3S*LineShort[2]
endif
//-------------------------------------------------//
// Oscillator Calculation
//-------------------------------------------------//
oscillator = LineShort-LineLong
//-------------------------------------------------//
// Standard deviation for the Oscillator
//-------------------------------------------------//
stdevOsc=std[lenStd](oscillator)
//-------------------------------------------------//
// normalize the Oscillator
//-------------------------------------------------//
MaxstdevOsc=highest[lenStd](stdevOsc)
normalizedOsc=hullaverage[30](oscillator/MaxstdevOsc)
if normalizedOsc> 0 then
r=0
g=188
b=212
else
r=255
g=152
b=0
endif
if barindex>2*lenStd+31 then
colorbetween(normalizedOsc,0,r,g,b,100)
endif
//-------------------------------------------------//
// Bands for the oscillator
//-------------------------------------------------//
basis=average[250,1](normalizedOsc)
deviation=2*std[250](normalizedOsc)
upperband=basis+deviation
lowerband=basis-deviation
//-------------------------------------------------//
// Signals
//-------------------------------------------------//
signalup=normalizedOsc<-threshold and normalizedOsc>normalizedOsc[1] and normalizedOsc[1]<normalizedOsc[2]
signaldown=normalizedOsc>threshold and normalizedOsc<normalizedOsc[1] and normalizedOsc[1]>normalizedOsc[2]
if signalup then
drawpoint(barindex,normalizedOsc,2)coloured("aqua")
elsif signaldown then
drawpoint(barindex,normalizedOsc,2)coloured("orange")
endif
//-------------------------------------------------//
return normalizedOsc as "Normalized Oscillator" coloured("darkblue")style(line,2),upperband as "UpperBand" coloured("grey"),lowerband as "LowerBand" coloured("grey"), threshold as "+Treshold"coloured("GREY"),-threshold as "-Treshold"coloured("GREY")
Comments
You must be logged in to post a comment.

You can change the code in the signals section to this one. //-------------------------------------------------// // Signals //-------------------------------------------------// signalUp = normalizedOsc normalizedOsc[1] and normalizedOsc[1] threshold and normalizedOsc normalizedOsc[2] if signalUp then if normalizedOsc upperBand then drawpoint(barindex, normalizedOsc, 2) coloured("red") else drawpoint(barindex, normalizedOsc, 2) coloured(255,152,0) endif endif Turquoise dot → Normal mean reversion up (oscillator below -threshold but above lower Bollinger band) Green dot → Strong mean reversion up (oscillator below the lower Bollinger band) Orange dot → Normal mean reversion down (oscillator above threshold but below upper Bollinger band) Red dot → Strong mean reversion down (oscillator above the upper Bollinger band)
Hi Ivan, sorry this did not seem to work, is it becuase it is missing the signal down? This is the code I have tried to replace the above with: //-------------------------------------------------// // Signals //-------------------------------------------------// signalup=normalizedOscnormalizedOsc[1] and normalizedOsc[1]threshold and normalizedOscnormalizedOsc[2] if signalup then drawpoint(barindex,normalizedOsc,2)coloured("aqua") elsif signaldown then drawpoint(barindex,normalizedOsc,2)coloured("orange") endif
Hi adeelq79, Yes — signaldown is missing, but there are also two issues with your signalup: the condition normalizedOsc<-threshold is gone (that's the key check — it ensures the oscillator was in oversold territory before starting the recovery), and the direction of the slope comparison is reversed. Here is the complete corrected Signals section to replace in your SPO: //-------------------------------------------------// // Signals //-------------------------------------------------// signalup=normalizedOscnormalizedOsc[1] and normalizedOsc[1]threshold and normalizedOscnormalizedOsc[2] if signalup then drawpoint(barindex,normalizedOsc,2)coloured("aqua") elsif signaldown then drawpoint(barindex,normalizedOsc,2)coloured("orange") endif // Strong Mean Reversion: oscillator crosses back through threshold from extreme zone strongUp = normalizedOsc > -threshold and normalizedOsc[1] < -threshold strongDown = normalizedOsc threshold if strongUp then drawtext("+",barindex,normalizedOsc)coloured("lime") elsif strongDown then drawtext("+",barindex,normalizedOsc)coloured("red") endif Aqua/orange dots = regular mean reversion signals. Green "+" / red "+" = strong mean reversion (oscillator crossing back through the threshold from extreme zone). Let me know if it works. Best, Iván
Sorry about that — the operators got stripped by the HTML when I posted the code. Here is the corrected Signals section with all operators visible: //-------------------------------------------------// // Signals //-------------------------------------------------// signalup = normalizedOsc > normalizedOsc[1] and normalizedOsc[1] normalizedOsc[2] signaldown = normalizedOsc threshold and normalizedOsc -threshold and normalizedOsc[1] < -threshold strongDown = normalizedOsc threshold if strongUp then drawpoint(barindex, normalizedOsc, 3) coloured("green") elsif strongDown then drawpoint(barindex, normalizedOsc, 3) coloured("red") endif
Sorry about that — the
<and>operators got stripped by the HTML when I posted the code. Here is the corrected Signals section with all operators visible: