







Smoothed Rate Of Change (S-ROC)
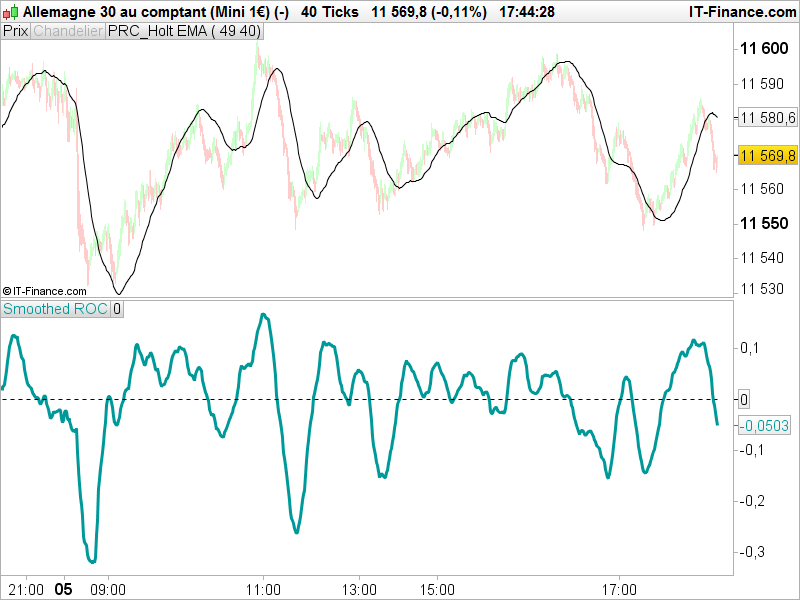
Smoothed Rate of Change (S-RoC) is a refinement of Rate of Change (RoC) that was developed by Fred G Schutzman. It differs from the RoC in that it based on exponential moving averages (EMAs) rather than on price closes. Like the RoC, Smoothed RoC is a leading momentum indicator that can be used to determine the strength of a trend by determining if the trend is accelerating or decelerating. The S-RoC does this by comparing the current EMA to value that the EMA was a specified periods ago. Thus, a 7-day S-RoC compares the current EMA to the value that the EMA was seven days ago. The use of EMAs rather than the price close illuminates the erratic tendencies of the RoC.
RoC is calculated in three steps. First, the EMA is calculated. Then the momentum of the change in the EMA is calculated by subtracting the previous value of the EMA from the current EMA. Finally, the result is divided by the previous value of the EMA and multiplied by 100 to give a percentage. As the S-RoC is a RoC of EMA, it takes two periods: the period of the EMA, with the default being 13; and the period of the RoC, with the default being 21. The formula is: S-RoC = ( Current EMA – Previous EMA ) / ( Previous EMA ) x 100 where the previous EMA is the value that the EMA was at specified period ago. The result is a percentage that is plotted as an oscillator that oscillates between 100% and -100%.
Coded by request on English forum.
//PRC_Smoothed ROC (S-ROC) | indicator
//06.01.2017
//Nicolas @ www.prorealcode.com
//Sharing ProRealTime knowledge

// --- parameters
//EMAperiod = 13
//ROCperiod = 21
// ---

EMA = exponentialaverage[EMAperiod](close)

SRoC = ( EMA - EMA[ROCperiod] ) / ( EMA[ROCperiod] ) * 100

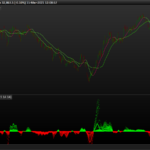
RETURN SRoC as "Smoothed ROC", 0 as "0"
Comments
You must be logged in to post a comment.
Hi Bard, angle of a MA is nothing more than a ROC oscillation. I assume, that's why you found this indicator for that purpose. You are right, the description I added in the post is wrong as the indicator doesn't seems to be bounded. I don't know the reason now, but I could look at it later.
Thanks for posting this indicator @Nicolas, I'm wondering if it's possible to have a % ROC scale for the Belkhayate COG -- https://www.prorealcode.com/reply/19219? (Because rise-run angles are meaningless, although I note there is a MT4 angle indicator). This way trades could be taken only when the linear regression of the Belkhayaye indicator is very strong, eg above 70%. From the description above: "The result is a percentage that is plotted as an oscillator that oscillates between 100% and -100%." What if a reading shows a result of 1.5? (which is an extreme result compared to the rest of the results: https://www.dropbox.com/s/wvb48musz21yfl7/bounded-or-not-bounded-scales%3F.png?dl=0) I must have a different interpretation of what a "bounded" oscillator scale is. I thought that the past events whether they're extreme values or minimal ones are all normalised to within a -100% to +100% scale so that if a result was +20 std deviations and the lowest result over the look back period was 1 std deviation then the +20 value would be at 100% whilst the 1 std deviation result would be at 5% on the scale? Which is why I was unsure about the Ehler's Deviation-Scaled Fisher Transform Oscillator scale... I thought those past results were normalised and bounded to within -100% and +100% so it's easy to see historically the percentage variations? https://www.prorealcode.com/topic/ehlers-deviation-scaled-fisher-transform-oscillator/#post-82425 Are either of these two codes possible? Cheers for any clarifications or insights because if you use the Belkhayate indicator and move it one bar at a time whilst paper trading it, it produces interesting results but it's hard to know how much of that is from re-painting? https://www.dropbox.com/s/5rx9thf6i0muigx/Belkhayate-COG.png?dl=0