The Squeeze & Release indicator is a technical tool designed to identify moments when the market is experiencing volatility compression (Squeeze) and when this compression is released (Release). This behavior often precedes significant price movements, as markets typically alternate between periods of low and high volatility.
The Squeeze & Release indicator uses the Average True Range (ATR) and other derived metrics to measure market volatility and the relationship between compression and expansion. This helps traders visualize potential breakout points and anticipate price directions.
How the Indicator Works
1. Calculating ATR and its EMA
The ATR (Average True Range) measures market volatility by considering the maximum range between high, low, and closing prices. This value is smoothed using an Exponential Moving Average (EMA), providing a more stable indicator.
The difference between the ATR and its EMA serves as the foundation for calculating the market’s relative volatility. Positive or negative values in this metric indicate changes in volatility intensity.
2. Squeeze Value and Its Moving Average
The Squeeze Value is a normalized metric that compares volatility to the price range (difference between the high and low). This value can be optionally smoothed to filter out market noise. A moving average of this value (SVMA) acts as a reference to identify crossovers and generate signals:
- Bullish crossover: Indicates a potential increase in volatility.
- Bearish crossover: Signals that pressure is decreasing.
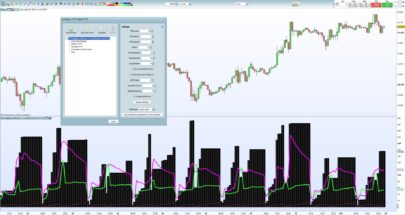
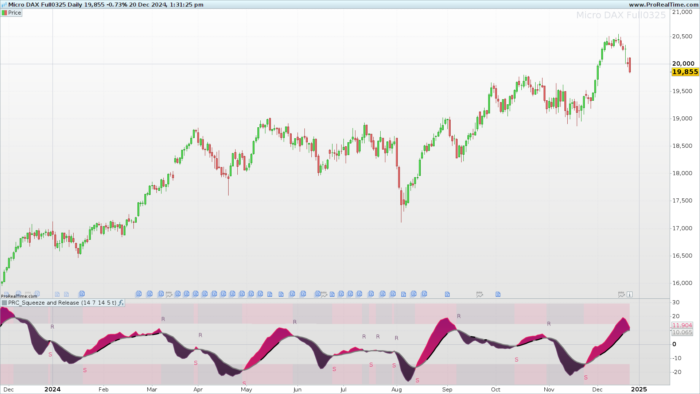
3. Colors and Visual Interpretation
The indicator uses color combinations to highlight market states:
- Active Squeeze (high indicator values): Represented by darker colors.
- Active Release (declining values): Shown with lighter colors.
- Crossovers between the Squeeze Value and its Moving Average provide additional visual signals.
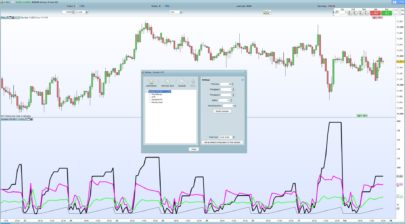
4. Zones of Interest and Thresholds
The indicator calculates thresholds based on standard deviations to highlight potential action zones. These areas serve as visual alerts to identify:
- Extreme compressions.
- Significant releases of volatility.
Filling between upper and lower zones helps traders easily identify these critical moments on a chart.
Configuration and Customization
The Squeeze & Release indicator offers several customizable parameters to adapt it to different assets and trading strategies:
- Calculation period: Defines the time range for ATR and other values.
- Smoothing length: Adjusts the indicator’s sensitivity to filter out noise.
- EMA length: Controls the smoothness of the reference line.
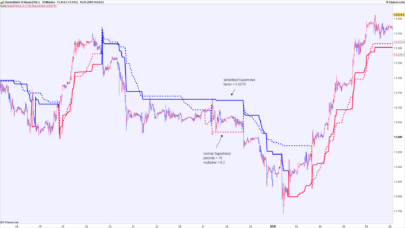
- Hyper Squeeze detection length: Helps identify prolonged compression periods.
- Enable/disable smoothing: Allows direct adjustment for more volatile charts.
Each of these parameters can be fine-tuned based on the type of asset (stocks, currencies, cryptocurrencies) or strategy (short-term, long-term).
Examples of Use
To better understand how this indicator works, here’s a practical example:
- Basic configuration:
- Calculation period: 14.
- Smoothing enabled.
- EMA length: 14.
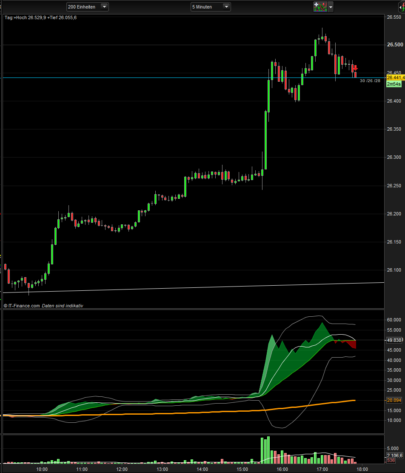
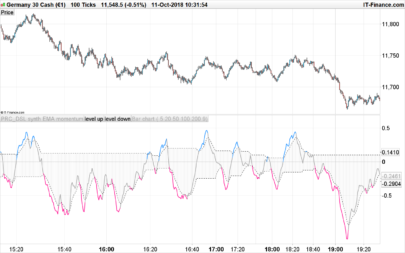
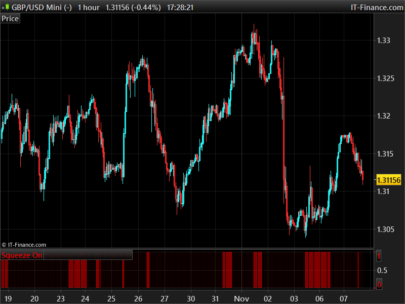
- Interpreting signals:
- On a 1-hour chart, observe shaded areas that indicate extreme compression zones.
- Wait for crossovers between the Squeeze Value and its Moving Average to take action.
- Potential application:
- Long entry: When the Squeeze Value crosses above its Moving Average and the market is at a support zone.
- Short entry: Bearish crossover combined with a resistance level.
Conclusion
The Squeeze & Release indicator is a powerful tool for analyzing volatility and anticipating significant market movements. Its customization options and clear visual representation make it a valuable resource for traders seeking opportunities in compressed markets.
However, like any technical indicator, it’s essential to use it in conjunction with other analyses to confirm signals and minimize risks. Its ability to adapt to various assets and trading styles makes it a versatile choice in the arsenal of technical analysis tools.
|
1 2 3 4 5 6 7 8 9 10 11 12 13 14 15 16 17 18 19 20 21 22 23 24 25 26 27 28 29 30 31 32 33 34 35 36 37 38 39 40 41 42 43 44 45 46 47 48 49 50 51 52 53 54 55 56 57 58 59 60 61 62 63 64 65 66 67 68 69 70 71 72 73 74 75 76 77 78 79 80 81 82 83 84 85 86 87 88 89 90 91 92 |
//-----------------------------------------------------// //PRC_Squeeze & Release //version = 0 //08.04.24 //Iván González @ www.prorealcode.com //Sharing ProRealTime knowledge //-----------------------------------------------------// //-----Inputs-----------------------------------------// //-----------------------------------------------------// periodForCalculation=14 //Calculation Period lengthForSmoothing=7 //Smoothing Length lengthForEMA=14 //EMA Length lengthForHyperSqueezeDetection=5 //Hyper Squeeze Detection Length enableSmoothing=1 //Enable Smoothing standarddeviationlength=min(barindex,4999) //-----------------------------------------------------// //-----Calculating ATR and its EMA---------------------// //-----------------------------------------------------// atr = average[periodForCalculation,1](TR(close)) emaofATR = average[periodForCalculation*2,1](atr) volatilityIndicator = emaofATR - atr //-----------------------------------------------------// //-----Calculating SV (Squeeze Value) and // //-----SVMA (Squeeze Value Moving Average) // //-----------------------------------------------------// emaHighLowDifference=average[periodForCalculation*2](high-low) if enableSmoothing then squeezeValue=average[lengthForSmoothing,1](volatilityIndicator / emaHighLowDifference * 100) else squeezeValue=volatilityIndicator / emaHighLowDifference * 100 endif squeezeValueMA=average[lengthForEMA,1](squeezeValue) //-----------------------------------------------------// //-----Color Main Line---------------------------------// //-----------------------------------------------------// if squeezeValue>0 and squeezeValue>=highest[lengthForHyperSqueezeDetection](squeezeValue) then ra=0 ga=0 ba=0 alpha=100 else ra=124 ga=124 ba=124 alpha=70 endif if squeezeValue > squeezeValueMA then //colorForSqueeze r=233/g=30/b=99 r=233 g=30 b=99 else //colorForRelease r=103/g=58/b=103 r=103 g=58 b=103 endif //-----------------------------------------------------// //----Plotting characters for Squeeze and Release-------// //-----------------------------------------------------// if squeezeValue crosses over squeezeValueMA then drawtext("S",barindex,squeezeValueMA - 10)coloured(233,30,99) elsif squeezeValue crosses under squeezeValueMA then drawtext("R",barindex,squeezeValueMA + 10)coloured(103,58,103) endif //-----------------------------------------------------// //-----Filling between MA and Value--------------------// //-----------------------------------------------------// COLORBETWEEN(squeezeValueMA,squeezeValue,r,g,b) if barindex <= periodForCalculation*3+lengthForEMA then meanvalue=0 squeezeValue=0 else meanValue=summation[barindex](squeezeValue)/barindex standardDeviation=std[standarddeviationlength](squeezeValue) endif thresholdUp=max((squeezeValue-meanValue)/(2*standardDeviation) * 100, 70) thresholdDown=max((meanValue-squeezeValue)/(2*standardDeviation) * 100, 70) upperLimit=meanValue+standardDeviation lowerHigh=meanValue-standardDeviation upperHigh=meanValue + 2*standardDeviation lowerLimit=meanValue - 2*standardDeviation colorbetween(upperLimit,upperHigh,r,g,b,30) colorbetween(lowerHigh,lowerLimit,r,g,b,30) //-----------------------------------------------------// return squeezeValue as "ATR"coloured(r,g,b)style(line,2),squeezeValueMA as "MovingAverageLine"coloured(ra,ga,ba)style(line,3) |
Share this
No information on this site is investment advice or a solicitation to buy or sell any financial instrument. Past performance is not indicative of future results. Trading may expose you to risk of loss greater than your deposits and is only suitable for experienced investors who have sufficient financial means to bear such risk.
ProRealTime ITF files and other attachments :
Find other exclusive trading pro-tools on ![]()
PRC is also on YouTube, subscribe to our channel for exclusive content and tutorials