“Stoch RSI” indicator

“Stoch RSI” indicator

This indicator was developped by Tushard Chande & Stanley Kroll.

The formula is simple. Someone asked me to make an indicator for ProRealTime.

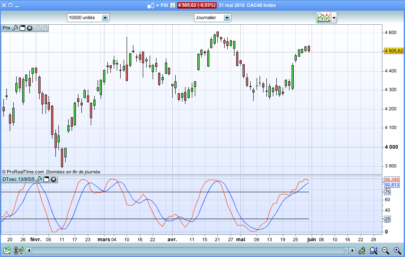
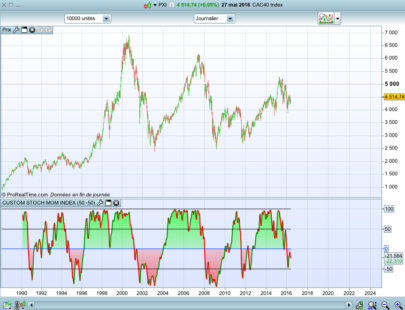
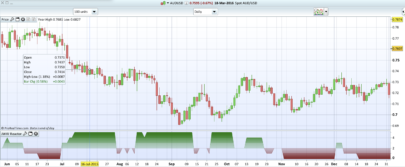
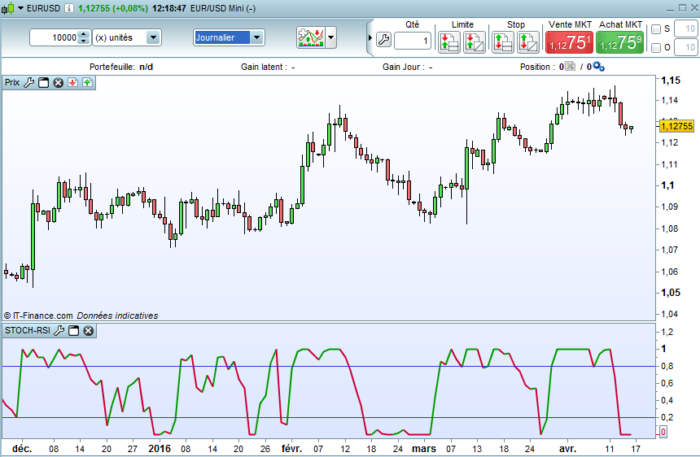
This indicator is limited from values 0 to 1.

You can simply change the colors and add 2 horizontal lines with value 0.2 (oversold) and 0.8 (overbought).

Share this

Risk disclosure:

No information on this site is investment advice or a solicitation to buy or sell any financial instrument. Past performance is not indicative of future results. Trading may expose you to risk of loss greater than your deposits and is only suitable for experienced investors who have sufficient financial means to bear such risk.

ProRealTime ITF files and other attachments : How to import ITF files into ProRealTime platform?

PRC is also on YouTube, subscribe to our channel for exclusive content and tutorials

avatar
Register or

Likes

avatar avatar avatar avatar avatar avatar avatar
Related users ' posts
MikeGC I don't know if you have used the variables a and b to optimise the parameters for the Super...
gianpiero75 I have not optimized, I multiplied the parameters for 6 (5,8), to use them on the 4  hoursTF...
bertrandpinoy bonjour Mike j utilise TrendChaser V2.0 et quand il prend position cela ne programme pas le ...
zilliq The reasons why I think it's time consuming and we loose time to try to do backests and Auto...
filiprb Hello Zilliq, You don't need a system to produce a walk forward test. You can easily create...
Philip Raphael It is incredible! Thanks for sharing, Doctrading!
s00071609 Hi, could you please suggest, what this codes gives, lowest[b](rsi[a]) -- just trying to us...
Nicolas lowest[b](rsi[a]) returns the lowest values of the RSI of "a" periods, over the last "b" per...
s00071609 Hi, what would be the code to get the price for last bullish DTOSC cross over. I am looking ...
Doctrading I forgot to write at the beginning :  a = 50 b = 50 These are intermediate levels Sorry
DerPat Thank you. This one could be an aid in my current research on stochastics.
Pelayo it is possible that in line 12 we should put seuilinf=-b, thaks for all
Doctrading It works on ProRealTime CFD, but backtest begins since May 2014
alex224 Hola Andres, buen trabajo. Algun problema por usar la estrategia con acciones en time frame ...
Andres Hola Alex, no lo he probado en otros timeframes, pero con esta configuración específica no c...
Nicolas RSI is an oscillator made for price centering. This strategy bet on mean reverting phenomena...
air Good start. Works decently during stock runaway bull market. I have tested it over 80 year p...
TheHovisTrader Hi - the way Larry trades it does not work - discovered that over 10 years ago! BUT If you ...
Glen Marquis I wonder how this fairs on 5 or 15 mins. Maybe 21 or 25 instead of 14 .
Doctrading Hello, you can test it. It's not my best strategy... but I think someone can improve it.
Investment Account Wow great thanks ... looks good! Do I set the colour shades up from within the indicator 's...
avatar
Anonymous Thanks for your comments and yes, that is exactly how I set up the colour levels.
Vish Thanks I have added this in my watch list. Has anyone tried it yet ? Does it work on currenc...
Nicolas
9 years ago
lokbuscas Or in weekly??
Nicolas I don't know, you should make your own studies.
lokbuscas Ok thanks Nico
Nicolas Aucune immobilisation du capital. Quel est le drawdown du buy & hold ? Je ne l'ai pas ca...
jctrader ok pour le codage mais le choix "indice" n'est pas le bon : moins de 5%/an pour le meilleur ...
Thomas Hi Nicloas nice one i do understand :D im trying to put in MA200 as a criteria so it only go...
Nicolas
9 years ago
Vinks_o_7 great, thanks Nicolas !
Vinks_o_7 argh...still nothing even with 10 000 bars on daily or hourly basis...
Vinks_o_7 ok now : had to refresh the indicator.

Top