It seems more efficient than the traditional stochastic
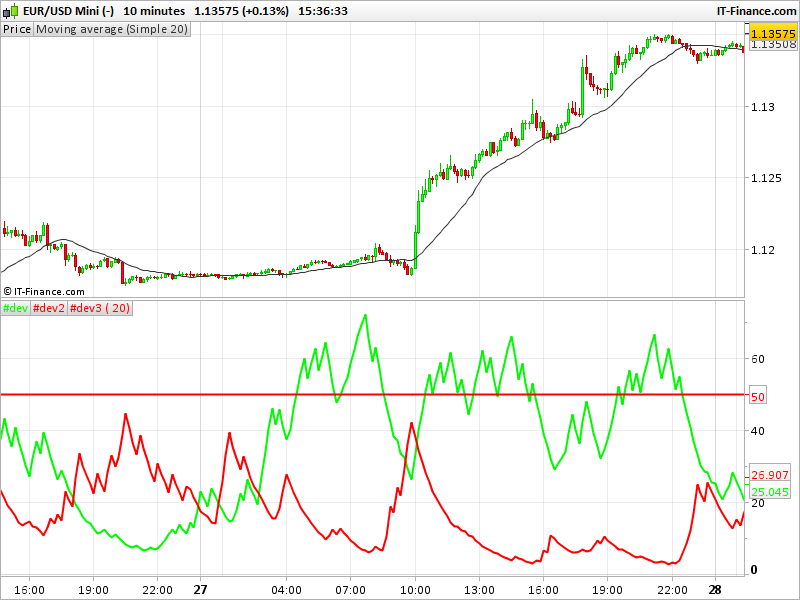
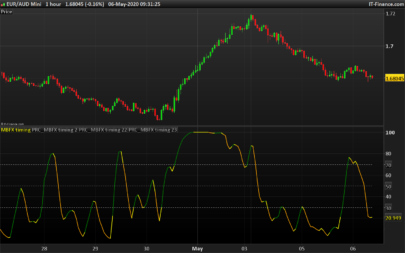
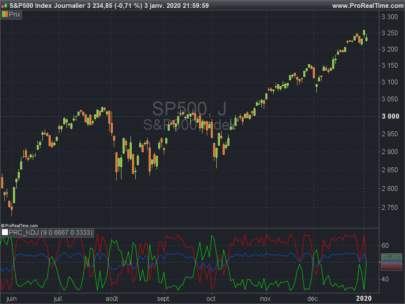
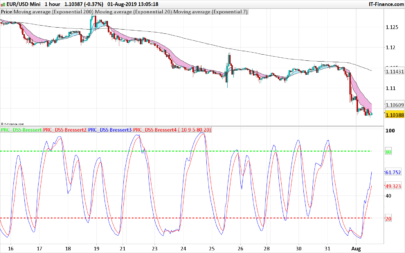
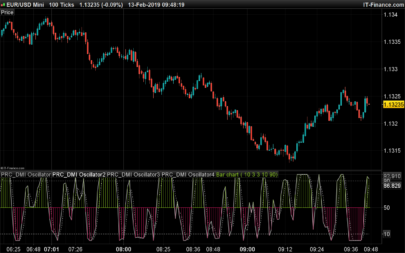
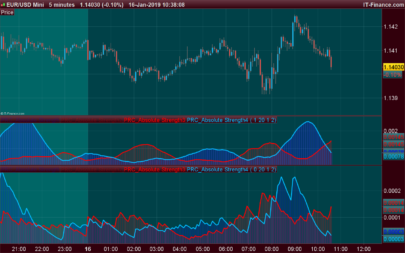
Over bought when the green line is over 50
Over sold when the red line is over 50
Parameter “b” can be optimized for any timeframe and security (period of the calculation).
Combined with patterns or divergences It gives very good signals
Try It if you wont and give me feedback
|
1 2 3 4 5 6 7 8 9 10 11 12 13 14 15 16 17 18 |
//settings: //b=20 if low < low[1] then llv = (highest[b](low)-low)/(highest[b](low)-lowest[b](low)) else llv = 0 endif LLSv = exponentialAverage[b](LLv)*100 if high > high[1] then hhs = (high - lowest[b](high))/(highest[b](high)-lowest[b](high)) else hhs=0 endif hhsv = exponentialaverage[b](hhs)*100 return hhsv coloured(0,250,0) style(line,2),llsv coloured(300,0,0) style(line,2),50 coloured(300,0,0) style(line,2) |
Share this
No information on this site is investment advice or a solicitation to buy or sell any financial instrument. Past performance is not indicative of future results. Trading may expose you to risk of loss greater than your deposits and is only suitable for experienced investors who have sufficient financial means to bear such risk.
ProRealTime ITF files and other attachments :PRC is also on YouTube, subscribe to our channel for exclusive content and tutorials


Thanks Pier for this contribution. Your indicator has a lot of similarity with the Directional Movement Index, where did you get the idea?
Nice Pier, I put inside also the adx ….
//settings//b=20
if low < low[1] thenllv = (highest[b](low)-low)/(highest[b](low)-lowest[b](low))elsellv = 0endifLLSv = exponentialAverage[b](LLv)*100
if high > high[1] thenhhs = (high – lowest[b](high))/(highest[b](high)-lowest[b](high))elsehhs=0endifhhsv = exponentialaverage[b](hhs)*100
myadx=adx[b]
return hhsv coloured(0,250,0) style(line,2),llsv coloured(300,0,0) style(line,2),50 coloured(300,0,0) style(line,2),myadx
Indicator not working in Beta Version 11.1 , Any idea ??
What is the issue with version 11 and this indicator please?