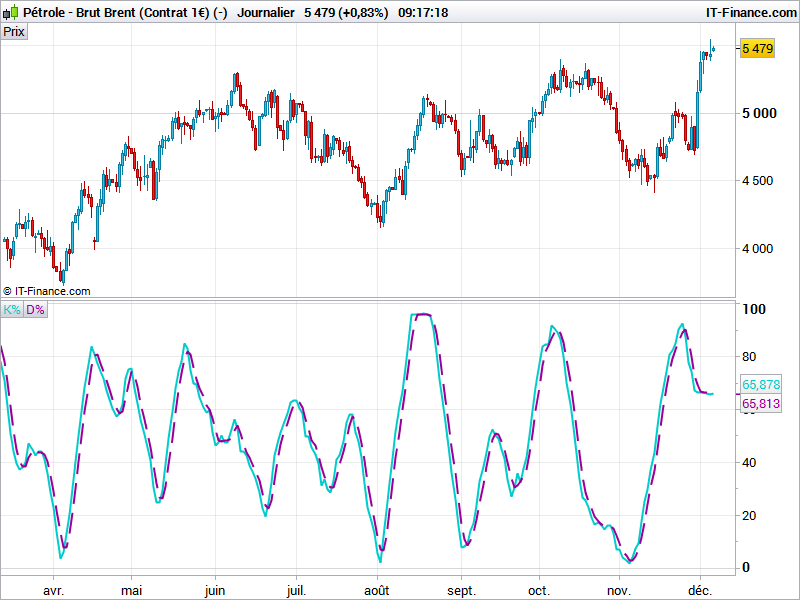
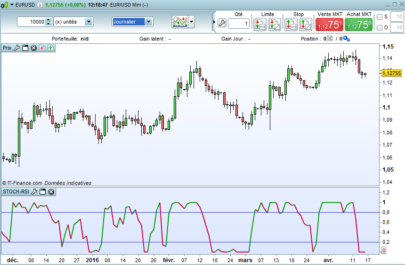
The stochastic RSI oscillator, applies RSI values instead of price into the stochastic formula.
Stochastic RSI = ((Today’s RSI – Lowest RSI Low in %K Periods) / (Highest RSI High in %K Periods – Lowest RSI Low in %K Periods)) * 100
Stochastic RSI measures the value of RSI in relation to its High and Low range over the required period:
when a regular RSI reaches a a new Low for the period, Stochastic RSI will be at 0. When RSI records a new high for the period, Stochastic RSI will be at 100.
This indicator was made by request on forum.
|
1 2 3 4 5 6 7 8 9 10 11 12 13 14 15 16 17 18 19 20 21 22 |
//PRC_Stochastic RSI | indicator //06.12.2016 //Nicolas @ www.prorealcode.com //Sharing ProRealTime knowledge //converted and adapted from Pinescript version // -- parameters: lengthRSI = 10 //RSI period lengthStoch = 10 //Stochastic period smoothK = 10 //Smooth signal of stochastic RSI smoothD = 3 //Smooth signal of smoothed stochastic RSI myRSI = RSI[lengthRSI](close) MinRSI = lowest[lengthStoch](myrsi) MaxRSI = highest[lengthStoch](myrsi) StochRSI = (myRSI-MinRSI) / (MaxRSI-MinRSI) K = average[smoothK](stochrsi)*100 D = average[smoothD](K) return K as "K%", D as "D%" |
Share this
No information on this site is investment advice or a solicitation to buy or sell any financial instrument. Past performance is not indicative of future results. Trading may expose you to risk of loss greater than your deposits and is only suitable for experienced investors who have sufficient financial means to bear such risk.
ProRealTime ITF files and other attachments :
Find other exclusive trading pro-tools on ![]()
PRC is also on YouTube, subscribe to our channel for exclusive content and tutorials


Hello Nicolas,
in what way does this indicator compare to the Stochastic RSI that is built-in into the PRT platform ? When I display the built-in indicator with a period of 10 units, I get a totally different picture. Do you know what the reason is ?
I don’t know about the formula of the one built-in into the platform. This one has been converted from the tradingview platform as a request on forum, and it is totally similar to the original indicator.
I found the reason. The indicator built into the PRT platform displays only the StochRSI variable in your code, not the averages K and D. So I think, StochRSI is kind of a fast stochastic indicator, whereas the smoothed K% and D% in your code are the slow stochastic variety. Would you agree ?
Well, in this indi you can choose the RSI period, the period of the stochastic calculation of the RSI and the 2 smoothing periods K and D.
Hi Nicolas,
I am working on building a StochRSI indicator. My RSI and StochRSI values are correct but I am having an issue in matching the %K values with a trading platform. Could you tell me the formula for calculating the %K?
The formula is the same as the above code. The K% is just the percentage of prive movement over a dynamic scale made by recent (periods) highest high and lowest low.
If you want this Indicator to look the same as the Stochastic RSI built into the PRT Platform then use the code below
Mmm seems the Add PRT Code does not work on Library Threads ??
Forked code I mention above is here …
GraHal wrote:
So below is the PRC Stochastic RSI v1.1 for anybody who wants it.
Try again (quite limited what you can do as Comments in the Library)
https://www.prorealcode.com/topic/prt_stochastic-rsi-v1-1/
Thanks GraHal, that’s what i was looking for