

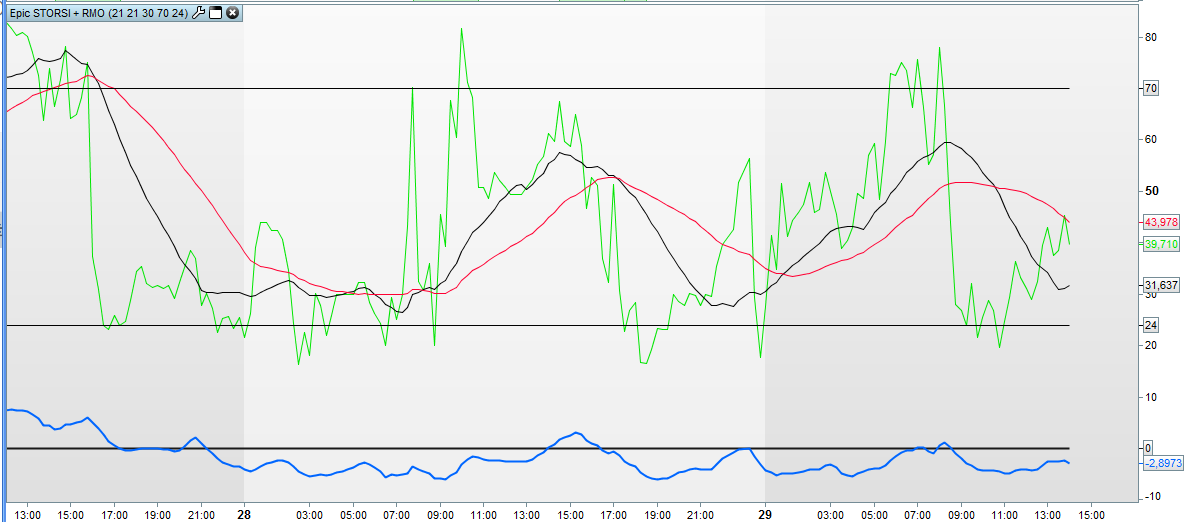
STORSI + RMO
August 31, 2017, 2:37 PM
Indicators
1 Comment
I have been fooling around with some copy pasting code. Some of the rahul mohindar oscillator combined with a customized STORSI.
Helps me find some triggers and also determine if this is a bull or bear market.
//--STORSI + RMO --//
// ------- settings
// p = bars STORSI (try and error, but 21 works good)
// a = bars MA (try and error, but 21 works good)
// c = 30
// f = 70
// g = 24

UP = MAX(0, close - close[1])
DOWN = MAX(0, close[1] - close)

upMA = wilderAverage[p](UP)
downMA = wilderAverage[p](DOWN)

RS = upMA / downMA

REM Computes the highest and lowest prices on p bars

hi = highest[p](high)
lo = lowest[p](low)

Epicline = ((100 - 100 / (1 + RS))+((close - lo) / (hi - lo) * 100)) /2

EpicMA = Average[a](Epicline)

Combo=(EpicMA+Epicline)/2
ComboMA=Average[c](Combo)

top=f
bot=g

myH = 0

MAI1 = Average[2](close)
MAI2 = Average[2](MAI1)
MAI3 = Average[2](MAI2)
MAI4 = Average[2](MAI3)
MAI5 = Average[2](MAI4)
MAI6 = Average[2](MAI5)
MAI7 = Average[2](MAI6)
MAI8 = Average[2](MAI7)
MAI9 = Average[2](MAI8)
MAI10 = Average[2](MAI9)

mai = (mai1 + mai2 + mai3 + mai4 + mai5 + mai6 + mai7 + mai8 + mai9 + mai10) / 10

top2 = highest[10](high)

bot2 = lowest[10](low)

ST1 = 100*(close - mai) / (top2 - bot2)

RMO = (ExponentialAverage[81](ST1))

RETURN Epicline COLOURED(0,230,0) AS "Epic STORSI", EpicMA AS "EpicMA", ComboMA COLOURED(255,0,50) as "Trigger", top as "Top Line", bot as "Bottom Line", myH COLOURED(204,204,204) AS "BullBearLine" , RMO AS "BullBear"
Download
Filename:
STORSI-RMO.itf
Downloads:
165
Junior
I usually let my code do the talking, which explains why my bio is as empty as a newly created file. Bio to be initialized...
Author’s Profile
Loading...