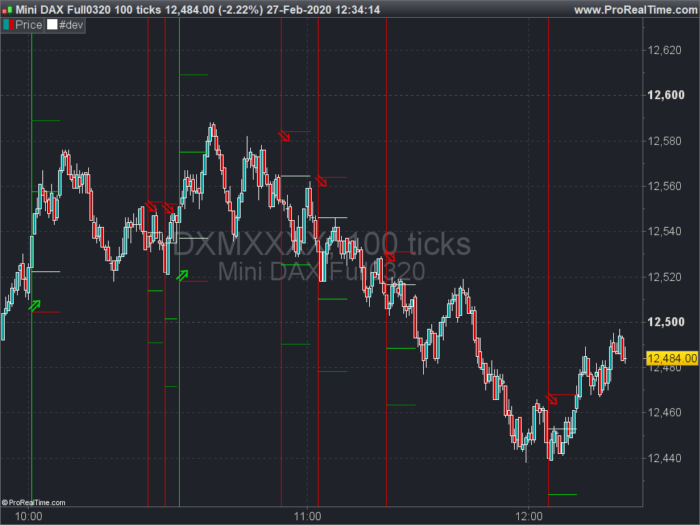
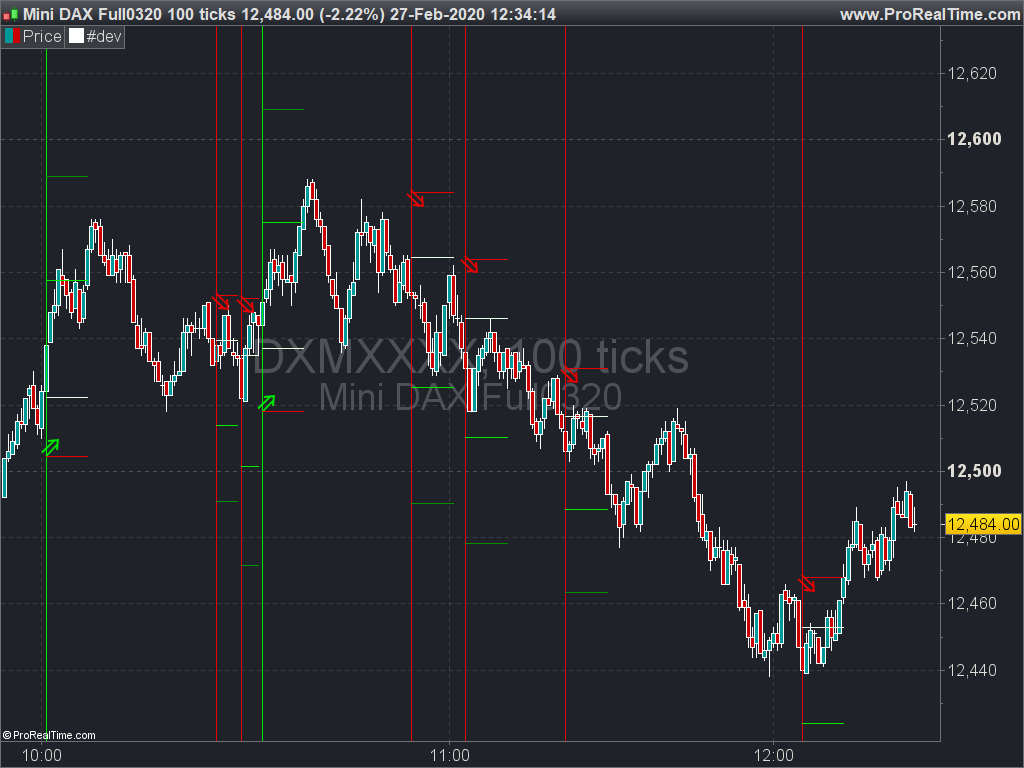
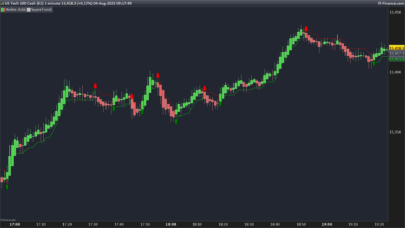
The indicator returns a signal for the bullish signal and for the bearish signal, so you can easily create an alert to warn you.
Here is an update of the “prc_scalpingsar-and-fibonacci” indicator, for more information please refer to the following > link < .
New:
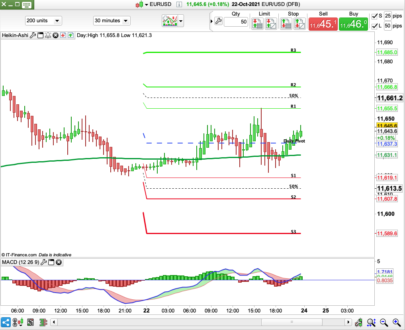
- Take profit 2 (261.8%)
- Add variable parameter(draw the line sl, tp1, tp2, entry and change stop loss)
- Delete view parabolic sar fast and slow
- Add signal bearish and bullish for audible alert
Exemple alert :
Signal SarFibo – Signal BEARISH >= Signal SarFibo – LVL Alert
Signal SarFibo – Signal BULLISH >= Signal SarFibo – LVL Alert
LvL Alert is always at 1, the signal bearish or bullish is at 0 and will become 1 if there is a signal.
|
1 2 3 4 5 6 7 8 9 10 11 12 13 14 15 16 17 18 19 20 21 22 23 24 25 26 27 28 29 30 31 32 33 34 35 36 37 38 39 40 41 42 43 44 45 46 47 48 49 50 51 52 53 54 55 56 57 58 59 60 61 62 63 64 65 66 67 68 69 70 71 72 73 74 75 76 77 78 79 80 81 82 83 84 85 86 87 88 89 90 91 92 93 94 95 96 97 98 99 100 101 102 |
//-+------------------------------------------------------------------+-// // | PRC_Scalping with Parabolic SAR and Fibonacci | indicator | // // | Author by: Nicolas @ www.prorealcode.com | // // | Modify by: Tom's - Leofi | // // | Last update: 27.02.20 | // //-+------------------------------------------------------------------+-// //-+------------------------------------------------------------------+-// // | Variable Setup | // //-+------------------------------------------------------------------+-// //-> Custom stop loss sizeStopLoss = 2 //-> Bars duration for plotting the fib zones plotBar = 10 //-> Draw line take profit (1) at 161.8% ? isActiveLineTP1 = 1 //-> Draw line take profit (2) at 261.8% ? isActiveLineTP2 = 1 //-> Draw line entry at 50% ? isActiveLineEntry = 1 //-> Draw line stop loss ? isActiveLineSL = 1 //-> Parabolic SAR fast and slow sarFast = SAR[0.02, 0.02, 0.2] sarSlow = SAR[0.005, 0.005, 0.05] //-+------------------------------------------------------------------+-// // | Signal Parabolic SAR | // //-+------------------------------------------------------------------+-// //-> Variable for alert signal alertLVL = 1 signalBullish = 0 signalBearish = 0 //-> Maximun highs and minimum lows IF (close < sarFast) THEN valueMinLow = min(valueMinLow, low) ELSE valueMinHigh = max(valueMinHigh, high) ENDIF //-> Bullish signal IF (close > sarFast and close[1] < sarFast[1]) THEN fibo = valueMinLow valueMinLow = sarSlow IF (close > sarSlow) THEN startbar = barindex irange = high - fibo entry = fibo + (irange / 2) tp1 = fibo + irange * 1.618 tp2 = fibo + irange * 2.618 sl = fibo - sizeStopLoss * pointsize //-> Send signal bullish drawtext(" ⇗", barindex, sl + (2 * pointsize), dialog, standard, 30) coloured(0, 233, 0) drawvline(barindex) coloured(0, 233 ,0) signalBullish = alertLVL ENDIF ENDIF //-> Bearish signal IF (close < sarFast and close[1] > sarFast[1]) THEN fibo = valueMinHigh valueMinHigh = 0 IF (close < sarSlow) THEN startbar = barindex irange = fibo - low entry = fibo - (irange / 2) tp1 = fibo - irange * 1.618 tp2 = fibo - irange * 2.618 sl = fibo + sizeStopLoss * pointsize //-> Send signal bearish drawtext(" ⇘", barindex, sl - (2 * pointsize), dialog, standard, 30) coloured(233, 0, 0) drawvline(barindex) coloured(233, 0 ,0) signalBearish = alertLVL ENDIF ENDIF //-> Draw tp1 and SL on graph IF (barindex - startbar <= plotbar) THEN IF (isActiveLineSL) THEN drawsegment(startbar, sl, barindex, sl) coloured(233, 0, 0) ENDIF IF (isActiveLineTP1) THEN drawsegment(startbar, tp1, barindex, tp1) coloured(0, 233, 0) ENDIF IF (isActiveLineTP2) THEN drawsegment(startbar, tp2, barindex, tp2) coloured(0, 144, 0) ENDIF IF (isActiveLineEntry) THEN drawsegment(startbar, entry, barindex, entry) coloured(233, 255, 233) ENDIF ENDIF RETURN signalBearish coloured(233, 0, 0) style(histogram) AS "Signal BEARISH", signalBullish coloured(0, 233, 0) style(histogram) AS "Signal BULLISH", alertLVL AS "LvL Alert" |
https://www.prorealcode.com/prorealtime-indicators/scalping-with-parabolic-sar-and-fibonacci/
https://www.prorealcode.com/user/nicolas/
Share this
No information on this site is investment advice or a solicitation to buy or sell any financial instrument. Past performance is not indicative of future results. Trading may expose you to risk of loss greater than your deposits and is only suitable for experienced investors who have sufficient financial means to bear such risk.
ProRealTime ITF files and other attachments :PRC is also on YouTube, subscribe to our channel for exclusive content and tutorials








edit: old link is dead. im sorry
Bonjour,
C’est bizarre, quand j’installe cet indicateur mon graphique des prix se resserre en haut de l’écran et je suis obligé de l’étirer à chaque fois que je change d’unité de temps. D’où cela peut-il venir ?
Dans les paramètres du prix, il faut choisir la mise à l’échelle basée sur le prix uniquement.
Good evening all,
Is there any way this indicator can be transferred into a strategy code?
Bonjour Nicolas,
Vous indiquez qu’il est possible d’insérer un signal d’alerte sur Parabolic SAR & Fibo. Comment faire quand on ne connait pas la programmation ?
Merci et bien cordialement
Jean
Pour créer des alertes, vous pouvez suivre ce petit tutoriel : https://www.prorealtime.com/fr/videos_tutorial/135_create_alerts
Bonjour Nicolas, cette stratégie est intéressante.
Par contre, en 2022, le code ne fonctionne plus certainement dû à la nouvelle version de PRT. J’ai des messages d’erreurs. Pourriez vous svp nous donner la version du code qui pourrait fonctionner sur PRT ?
Cordialement Thibault
Aucun message d’erreur pour ma part en version 11.1.
Tu es certain de créer un code d’indicateur ?