Super bandpass filter – John Ehlers

Super bandpass filter – John Ehlers

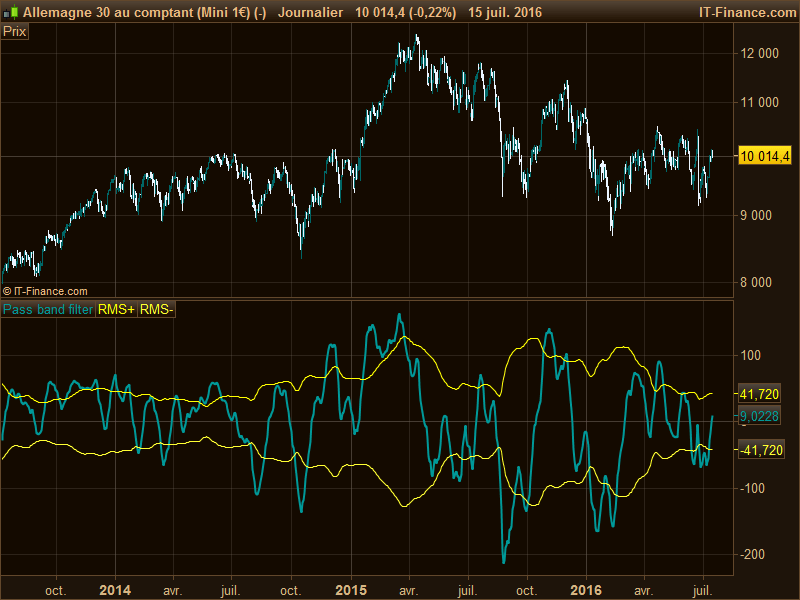
Here is the newest indicator by John Ehlers described in the new traders’tips of July 2016, like his other indicators this one is also a nearly-zero lag filter which is another attempt to filter out noises from high and low frequencies of market data.

John Ehlers describe the trading rules of this new indicator as this:

  • Buy on the filter crossing above its -RMS line
  • Short on the filter crossing below its RMS line
  • Exit long when the filter either crosses below its RMS or crosses below -RMS (which signifies a false entry signal)
  • Cover short when the filter either crosses above its -RMS or crosses above RMS (which signifies a false entry signal)


Share this

Risk disclosure:

No information on this site is investment advice or a solicitation to buy or sell any financial instrument. Past performance is not indicative of future results. Trading may expose you to risk of loss greater than your deposits and is only suitable for experienced investors who have sufficient financial means to bear such risk.

ProRealTime ITF files and other attachments : How to import ITF files into ProRealTime platform?

PRC is also on YouTube, subscribe to our channel for exclusive content and tutorials
  1. Hans63 • 07/17/2016 #

    For intraday purpose I tried to modify the parameters
    Rules are different. It works like a stop and reverse
    Long on the filter crossing above its RMS line. Stay Long until the filter is crossing below the lower line (band), then reverse the position from Long to Short
    Short on the filter crossing below its RMS line. Stay Short until the filter is crossing above the higher line (band), then reverse the position from Short to Long
    It works well on Germany 30 5 min
     
    // parameters
    flen = 20//fast length
    slen = 30 //slow length

    if barindex>slen then
    a1= 5/flen
    a2= 5/slen
    PB = (a1 - a2) * close + (a2*(1 - a1) - a1 * (1 - a2))* close[1] + ((1 - a1) + (1 - a2))*(PB[1])- (1 - a1)* (1 - a2)*(PB[2])
    RMSa = summation[25](PB*PB)
    RMSplus = sqrt(RMSa/25)
    RMSminus = -RMSplus
    endif

    RETURN PB as \"Pass band filter\", RMSplus as \"RMS+\", RMSminus as \"RMS-\"


    • Nicolas • 07/17/2016 #

      Nice, thanks for sharing. How much profitability lookback do you have with this indicator modification? 

  2. Hans63 • 07/17/2016 #

    Well, I am a discretionary trader, so I don’t trade all the signals given by a system or by indicators
    All I can say is that this indicator give you good entry points.
     

    • Nicolas • 07/17/2016 #

      …and that’s clever, thanks again for your feed back and your sharing.

avatar
Register or

Likes

avatar avatar avatar avatar avatar avatar avatar avatar avatar avatar
Related users ' posts
Ciccarelli Franco I tuoi indicatori sono sempre molto interessanti, al riguardo ti chiedo chiarimenti: I colo...
Iván Ciao, forse è perché hai la versione V11 e non la V12? Se è così, nelle righe in cui ti vie...
Iván Salve, grazie. I colori cambiano a seconda della posizione del prezzo e se ha superato il l...
Ciccarelli Franco Scusa e cosa devo cambiare? Grazie
Sofitech Bonjour Ivan, comment pourrais tu modifier ce code pour qu'un histogramme indiquant la créat...
geroniman Merci Ivan, cet indicateur est excellent. Comme les cours s'arretent souvent sur les 50% d'u...
sanchota Mira que has hecho unos cuantos indicadores,pues este los supera a todos.Brillante.
Gaspare Grazie Ivan, ottimo indicatore posso chiedere, per favore, una strategia che apre posizio...
Iván thanks! maybe I could test it
foufurieux
4 weeks ago
ANTS indicator
ANTS indicator
3
Indicators
atlante good morning the indicatordoes not display the photo you postes only upload nessages appear ...
foufurieux Please find a new image of the indicator
foufurieux Sorry impossible adding a new image
jacquesgermain
2 months ago
jacquesgermain à utiliser en unité de temps jour
patapouf Pourrait-on créer un screener sur la base de cet indicateur, dont l'idée semble très pertine...
jacquesgermain le voici (détecte le croisement bande haute ou bande basse) : timeframe(monthly) c1=open ...
okeus Ivan, riesci a creare un indicatore per le "evolventi paraboliche" ? grazie
groelandes Impagable tu trabajo cada semana. ¡Gracias!
Iván de nada! :)
Row trading Hi, to see the current day put : for y = i-1 to i-1 do to see all days put : for y = 1 t...
Razz Hi, thanks for your answer. I'll keep an eye on the whole thing, I've now expanded it to in...
Razz Adding an image did not work : https://www.directupload.eu/file/d/8765/3ez6bzlq_png.htm
f1_maik Well programmed, but in my eyes ‘only’ better Bollinger Bands with all their quirks and fals...
groelandes Me uno al comentario de Edelmiro. Un millón de gracias por el trabajo constante, dándonos in...
JohnScher Ja, das würde mich auch interessieren
Iván
3 months ago
Madrosat Bonjour Ivan je ne sais pas si je dois écrire en Français ,anglais ,espagnol ,il y a les 3 ...
Iván Bonjour, la vérité est que ce n'est pas aussi facile qu'il n'y paraît.... Un indicateur peut...
Madrosat Merci Ivan j'espère que ce jour viendra bientôt , je sais que ce n'est pas facile car les in...
Iván
3 months ago
Madrosat Bonjour ivan Quelle différence il y a t il entre Extra trend et ultra trend lequel est le p...
P. Marlowe Muy bueno. ¿Podría hacerse para señalar extremos por el lado bajista? Lo mismo a la inversa....
Miro Esta es una versión del indicador, para ambos extremos. //-------------------------------...
P. Marlowe Muchas gracias ¡¡

Top