Super Trend Fisher Indicator

Super Trend Fisher Indicator

Discover the Super Trend Fisher Indicator: Analysis and Applications in ProRealTime

Introduction

The Super Trend Fisher indicator stands out as an advanced tool that combines several analytical methods to deliver clear and timely signals. This indicator is especially valued for its ability to adapt to different market conditions and its ease of integration into various trading strategies.

Description of the Super Trend Fisher Indicator

The Super Trend Fisher is a complex technical indicator that incorporates elements of the Detrended Price Oscillator, Fisher Transform, and the calculation of the Average True Range (ATR) to dynamically adjust trend levels. Its main goal is to identify the direction of the trend and signal possible reversals, using a methodology that adjusts its parameters in real-time to capture market volatility.

  • Detrended Price Oscillator (DPO): Measures the deviation of the price from its moving average, helping to identify short-term price cycles stripped of long-term trends.
  • Fisher Transform: Converts prices into a Gaussian distribution to produce clearer and timelier signals.
  • Average True Range (ATR): Used to calculate market volatility, the ATR helps adjust the SuperTrend thresholds to be more responsive during volatile market conditions.
  • SuperTrend: Combines direction of the trend and volatility, offering a clear visual summary of the current market situation.

Functioning of the Indicator

The Super Trend Fisher uses a combination of analytical techniques to provide an integrated and deeply contextual view of market behavior. Below is an explanation of how each component of the indicator is calculated:

  • Calculation of the Detrended Price Oscillator: The moving average is subtracted from the closing price, which helps eliminate long-term price variations and focus on short-term fluctuations.
  • Application of the Fisher Transform: This transform alters the distribution of price data to make overbought and oversold areas more identifiable and accessible for technical analysis.
  • Integration of the ATR: The ATR adjusts the limits of the SuperTrend according to market volatility, allowing the indicator to be effective under different market conditions.

Practical Applications

The Super Trend Fisher indicator is exceptionally useful for traders looking to quickly identify market trends and reversal points. Here are some ways to interpret the signals provided by this indicator:

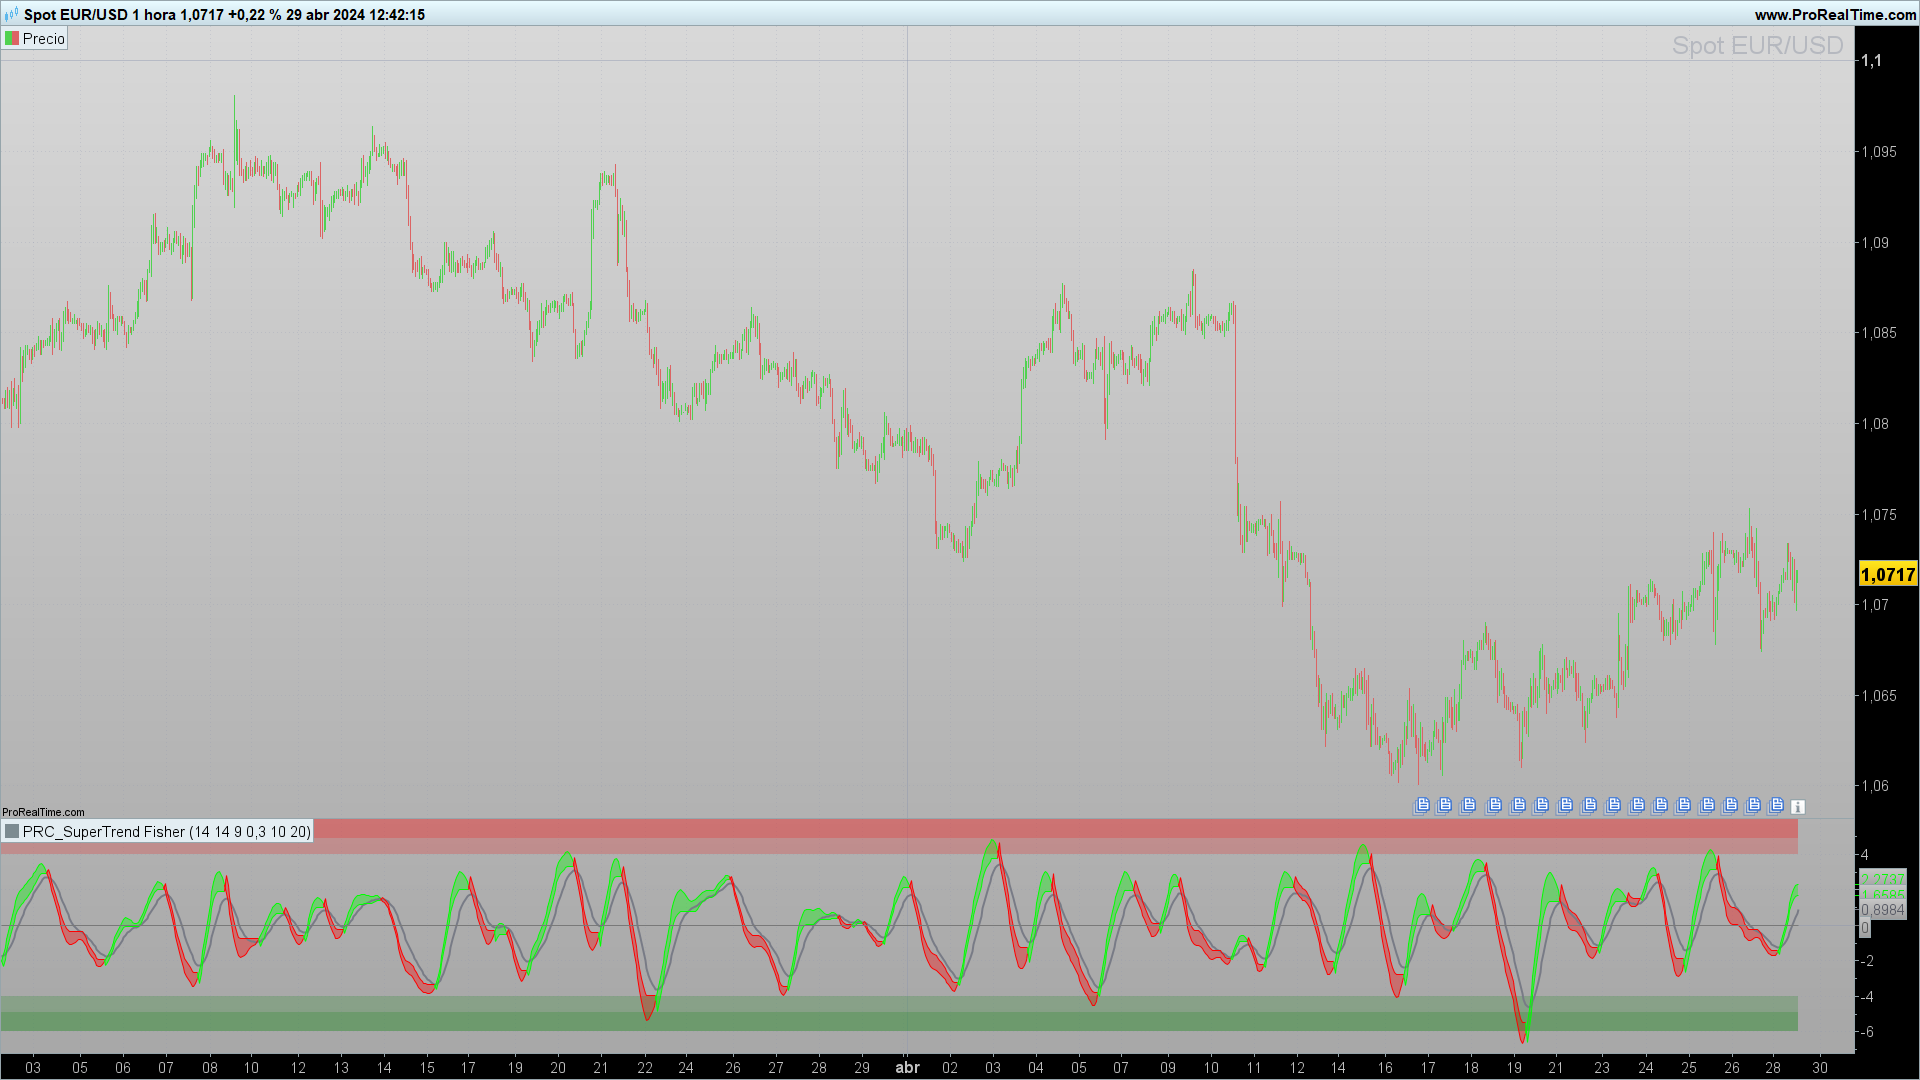
  • Trend Identification: When the indicator moves above the zero level and changes color, it indicates a possible entry into an uptrend. Conversely, a movement below the zero level with a color change suggests a downtrend.
  • Buy and Sell Signals: A buy signal may be considered when the Super Trend Fisher changes from red to green and is above the zero line. Conversely, a sell signal is suggested when it changes from green to red and is located below the zero line.
  • Optimization of Entries and Exits: Combining the Super Trend Fisher with other momentum or volume indicators can help refine entries and exits, thereby improving risk management and the effectiveness of trading strategies.

Setup and Customization

Copy and paste the code provided in the programming section of the editor. Adjust the parameters period, length, len, stFactor, and stPeriod according to your specific needs to tailor the sensitivity and reactivity of the indicator.

  • Application and Analysis: Once the code is adjusted, apply the indicator to the chart. Observe how the indicator interacts with price movements and adjust settings if necessary to optimize signals.

Conclusions

The Super Trend Fisher indicator offers a robust combination of technical analysis and adaptability, making it a valuable tool for any trader. Its ability to integrate multiple analytical techniques into a single indicator allows for a richer and more nuanced interpretation of the markets. As with any trading tool, it is recommended to combine the Super Trend Fisher with proper risk management and a coherent trading strategy.

Share this

Risk disclosure:

No information on this site is investment advice or a solicitation to buy or sell any financial instrument. Past performance is not indicative of future results. Trading may expose you to risk of loss greater than your deposits and is only suitable for experienced investors who have sufficient financial means to bear such risk.

ProRealTime ITF files and other attachments : How to import ITF files into ProRealTime platform?

PRC is also on YouTube, subscribe to our channel for exclusive content and tutorials

  1. Stenozar • 314 days ago #

    Scusa Ivan, ho trovato un’altra versione di supertrend, Kalmana Hull Supertrand, che mi pare interessante ma non mi fa creare un nuovo topic, non so per quale motivo. Provo a incollare il codice qui, se tu potessi tradurlo. Grazie
    /////////////////////////////////////////////////////////////// © BackQuant ///////////////////////////////////////////////////////////////
    // This Pine Script™ code is subject to the terms of the Mozilla Public License 2.0 at https://mozilla.org/MPL/2.0/
    // © BackQuant

    //@version=5
    indicator(
    title = “Kalman Hull Supertrend [BackQuant]”,
    shorttitle = “Kalman Hull ST [BackQuant]”,
    overlay=true,
    precision = 2,
    format = format.price,
    timeframe = “”,
    timeframe_gaps = true
    )

    // Define User Inputs
    series float pricesource = input.source(close, “Kalman Price Source”, group = “Calculation”)
    simple float measurementNoise = input.float(3.0, title=”Measurement Noise”, group = “Calculation”, tooltip = “Lookback Period/ Calculation Length”, step = 1.0)
    simple float processNoise = input.float(0.01, title=”Process Noise”, step = 0.01, group = “Calculation”)

    simple int atrPeriod = input.int(12, “ATR Period”, group = “Supertrend”, inline = “ST”)
    simple float factor = input.float(1.7, “Factor”, group = “Supertrend”, inline = “ST”, step = 0.01)

    simple bool showkalman = input.bool(true, “Show Supertrend on chart?”, group = “UI Settings”)
    simple bool paintCandles = input.bool(true, “Paint candles according to Trend?”, group = “UI Settings”)
    simple bool showlongshort = input.bool(true, “Show Long and Short Signals { + }”, group = “UI Settings”)

    color longColor = input.color(#33ff00, “Long Color”, group = “UI Settings”, inline = “Col”)
    color shortColor = input.color(#ff0000, “Short Color”, group = “UI Settings”, inline = “Col”)
    /////////////////////////////////////////////////////////////// © BackQuant ///////////////////////////////////////////////////////////////
    // Kalman Price Filter Function
    N = 5
    var float[] stateEstimate = array.new_float(N, na)
    var float[] errorCovariance = array.new_float(N, 100.0)
    f_init(series float pricesource) =>
    if na(array.get(stateEstimate, 0))
    for i = 0 to N-1
    array.set(stateEstimate, i, pricesource)
    array.set(errorCovariance, i, 1.0)

    f_kalman(series float pricesource, float measurementNoise) =>
    // Prediction Step
    predictedStateEstimate = array.new_float(N)
    predictedErrorCovariance = array.new_float(N)
    for i = 0 to N-1
    array.set(predictedStateEstimate, i, array.get(stateEstimate, i)) // Simplified prediction
    array.set(predictedErrorCovariance, i, array.get(errorCovariance, i) + processNoise)

    kalmanGain = array.new_float(N)
    for i = 0 to N-1
    kg = array.get(predictedErrorCovariance, i) / (array.get(predictedErrorCovariance, i) + measurementNoise)
    array.set(kalmanGain, i, kg)
    array.set(stateEstimate, i, array.get(predictedStateEstimate, i) + kg * (pricesource – array.get(predictedStateEstimate, i)))
    array.set(errorCovariance, i, (1 – kg) * array.get(predictedErrorCovariance, i))

    array.get(stateEstimate, 0)

    f_init(pricesource)
    kalmanFilteredPrice = f_kalman(pricesource, measurementNoise)
    /////////////////////////////////////////////////////////////// © BackQuant ///////////////////////////////////////////////////////////////
    // Hull Moving Average Function with Kalman instead of Weighted Moving Average
    KHMA(_src, _length) =>
    f_kalman(2 * f_kalman(_src, _length / 2) – f_kalman(_src, _length), math.round(math.sqrt(_length)))
    // Return
    kalmanHMA = KHMA(pricesource, measurementNoise)
    /////////////////////////////////////////////////////////////// © BackQuant ///////////////////////////////////////////////////////////////
    // Supertrend Function
    supertrend(factor, atrPeriod, src) =>
    atr = ta.atr(atrPeriod)
    upperBand = src + factor * atr
    lowerBand = src – factor * atr
    prevLowerBand = nz(lowerBand[1])
    prevUpperBand = nz(upperBand[1])

    lowerBand := lowerBand > prevLowerBand or close[1] < prevLowerBand ? lowerBand : prevLowerBand
    upperBand := upperBand prevUpperBand ? upperBand : prevUpperBand
    int direction = na
    float superTrend = na
    prevSuperTrend = superTrend[1]
    if na(atr[1])
    direction := 1
    else if prevSuperTrend == prevUpperBand
    direction := close > upperBand ? -1 : 1
    else
    direction := close < lowerBand ? 1 : -1
    superTrend := direction == -1 ? lowerBand : upperBand
    [superTrend, direction]

    // Call Function with Inputs
    [superTrend, direction] = supertrend(factor, atrPeriod, kalmanHMA)
    /////////////////////////////////////////////////////////////// © BackQuant ///////////////////////////////////////////////////////////////
    // Conditional Trend
    SupertrendLong = ta.crossunder(direction, 0)
    SupertrendShort = ta.crossover(direction, 0)
    var Trend = 0
    if SupertrendLong and not SupertrendShort
    Trend := 1

    if SupertrendShort
    Trend := -1

    // Colouring
    var barColour = #ffffff
    if Trend == 1
    barColour := longColor
    if Trend == -1
    barColour := shortColor

    // Plotting
    plot(
    showkalman ? superTrend : na,
    "Kalman Hull ST",
    color = color.new(barColour, 40),
    linewidth = 4
    )

    barcolor(paintCandles ? barColour : na)

    // Long and Short Signals ()
    plotshape(
    showlongshort ? SupertrendLong : na,
    offset=0,
    title="Long",
    text="",
    style=shape.triangleup,
    location=location.belowbar,
    color=barColour,
    textcolor=barColour,
    size = size.tiny
    )
    plotshape(
    showlongshort ? SupertrendShort: na,
    offset=0,
    title="Short",
    text="",
    style=shape.triangledown,
    location=location.abovebar,
    color=barColour,
    textcolor=barColour,
    size = size.tiny
    )

    // Alert Conditions
    alertcondition(SupertrendLong, title="Kalman Hull ST Long", message="Kalman Hull ST Long {{exchange}}:{{ticker}}")
    alertcondition(SupertrendShort, title="Kalman Hull ST Short", message="Kalman Hull ST Short {{exchange}}:{{ticker}}")

    • Iván • 312 days ago #

      Ciao
      Certo, posso analizzare il codice per tradurlo, ma devi lanciare la richiesta da qui:
      https://www.prorealcode.com/free-code-conversion/

  2. Stenozar • 311 days ago #

    Ciao Ivan, ho provato ma non mi lascia caricare il post, non so per quale strano motivo…

    • Iván • 311 days ago #

      Allora crei un nuovo post. Lo aspetterò.

    • Stenozar • 307 days ago #

      Ciao Ivan, ho inserito il post con la richiesta di traduzione. Se puoi vedere, grazie!

    • Iván • 304 days ago #

      perfect!

avatar
Register or

Likes

avatar avatar avatar avatar avatar avatar avatar avatar avatar
Related users ' posts
zilliq Thanks @Nicolas. I tried to use it as Trend in a proorder system, but don't know why, it doe...
Suzu Yuk He is right. MT and mavgMT are not defined and causing errors.....
RakeshPoluri I have a question about the bands on the candles. Is it bollinger bands or something else?
Nicolas I think that's 2 Bollinger Bands
Emperor.it "style(line,2)" C'è una guida ai parametri che si possono modificare ? Tipo stile della lin...
IV Mcm https://www.prorealcode.com/programming-with-prorealtime/
StephFor //ind1 = ZigZagPoint[2*averagetruerange[200]](close) avr = 3 //3% ind1 = ZigZag[avr](close...
Manu L. @Steph un grand merci pour ton aide mais :-( J'ai copier le code tel quel mais cependant j...
AlphaMauss Je n'ai pas réussi à faire fonctionner l'indicateur avec le code fourni en commentaire sur P...
Daniele Maddaluno Écrivez-moi où vous préférez you can easily find me on LinkedIn
AK27 C'est payant visiblement sur linkdin je peux pas vous envoyer, discord vous avez ?
Pensera Bonjour Nicolas, comment est-il possible de backtester cet indicateur? cela fait une erreu...
Nicolas Oui bien sûr, il doit y avoir pas mal de sujets dans le forum à ce propos.
simmerseb Bonjour, merci beaucoup pour cet indicateur je le trouve très clair et pertinent.
Nicolas Il doit s'agir d'un mauvais copier/coller. Je suggère de télécharger le fichier itf contenu ...
Bard Hello @Nicolas, I can get this to display in a separate indicator panel but not on Price as ...
Stenozar Hi @Nicolas, how can I put the bands on price? Thanks, Stefano
mickey992 salut merci pour ton partage et ton travaille
patapouf Hi Vivien René I just discovered your “Ordered trend-following stocks Screener”. Great work...
Nicolas Oui c'est possible. Merci de ne pas poster des demandes qui sont hors sujets. Pour les deman...
Igor Merci pour cet itf. Question : comment faire pour instruire un screener ?
Nicolas tester le croisement du Close avec la première valeur de l'indicateur : "TrailingStop", faci...
Nicolas Oui le code est correct et il fonctionne, j'ai de bons résultats sur la liste NASDAQ par exe...
pincherman Bonjour :-) J'ai coller le script dans prorealtime pour jouer avec le supertrend et j'ai un...
Nicolas Vous l'avez sans doute collé au mauvais endroit, dans l'éditeur de code pour les stratégies,...
Guillaume Mcm I gave the above message fix ;)
Tradingrob Is it possible to put the itf-file in the right way here in Prorealcode? so the right 'trend...
Guillaume Mcm Update link ;) https://www.prorealcode.com/topic/trend-histogramme-cci-mise-a-jour-suite-...
Screw27 Hi man, I installed the indicator and i don't know why but my graph it is so big
HelixKing sounds interesting I'll take a look
Godo Bonjour Souhait Sam, Après de nombreux essais pour le mettre en format afin d'utiliser ce c...
Nicolas Il faut supprimer celles qui existent dans la fenêtre d'optimisation et les créer en dur dan...
crusoe76 hi there, anyone can help making this strategy work, i have a message saying replace variabl...
Screw27 Salut nicolas j'aimerais savoir tes résulats grace a cettte methode
eva.g.forsgren It dose not work, I get a strap instead of candels???????????????????????????????????????????
Nicolas That indicator is the one below the chart. The indicator to put on the price chart is this o...
pyhrus P.S : IG , que j'ai contacté ,m'indique que la version V11 , ne sera pas disponible avant un...
Hasardeur Dear Nicolas, is there someting at the arry to modify in order to run the trend at the actu...
MALIMALO Dear Nicolas, just try touse your indicator with backtest but it's not working. is anybody...
ribes65 Bonjour Nicolas, Merci pour votre travail. Est-il envisageable de créer un screener pour ...
Nicolas Bien sûr, merci de formuler une demande dans le forum des screeners pour prorealtime. En res...
ipbvba Est il possible de le transformer en indicateur (pour ne plus avoir les lignes mais uniqueme...
supertiti Bonjour Nicolas, Je ne comprend pas bien , le trend change de couleur quand les prix sont a...
Nicolas Oui ce serait possible, cependant l'indicateur est bien prévu pour conserver la couleur de l...
supertiti Quand tu pourras si tu peux nous coder la troisième couleur cela améliorerait les trades cou...

Top