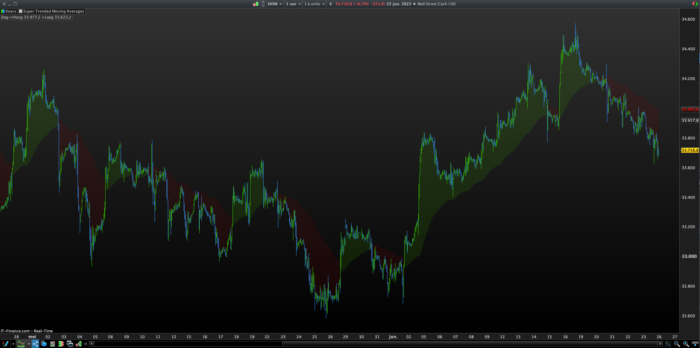
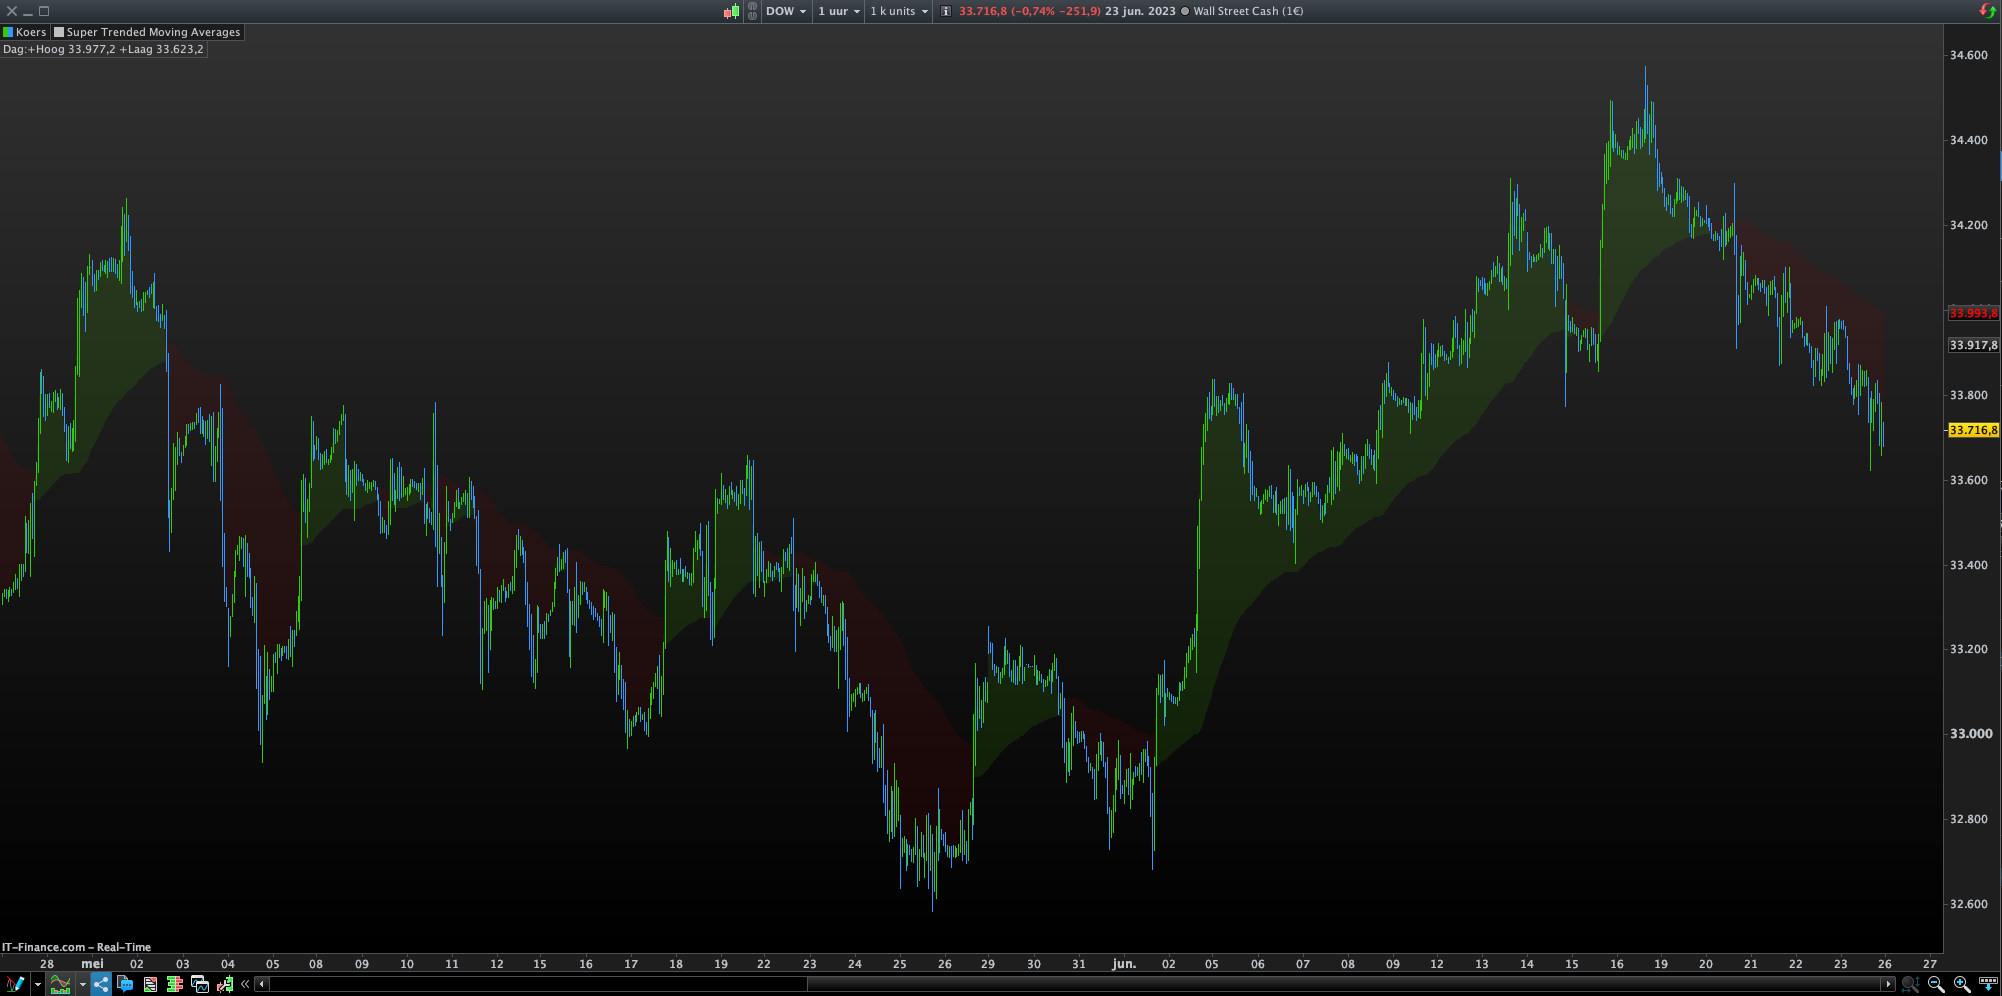
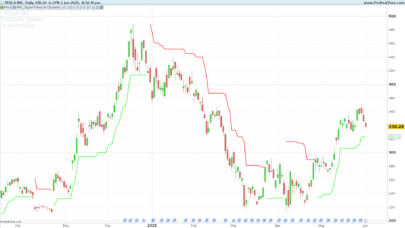
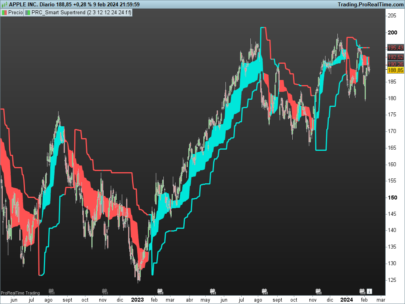
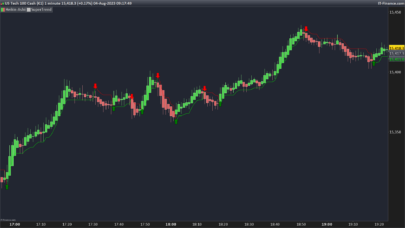
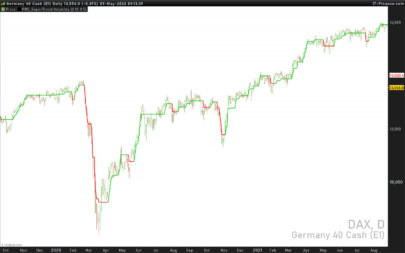
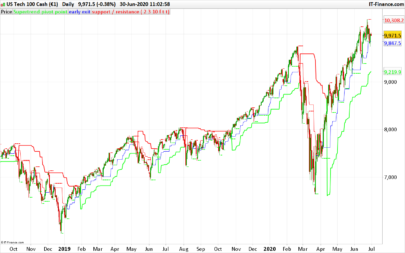
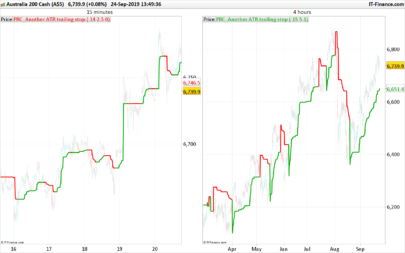
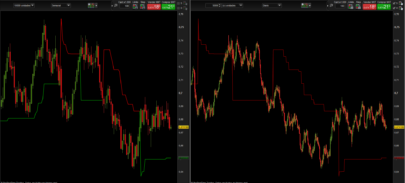
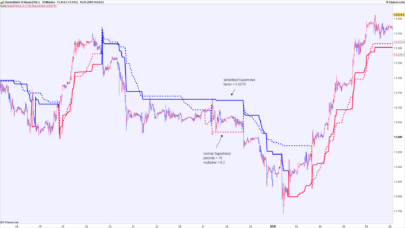
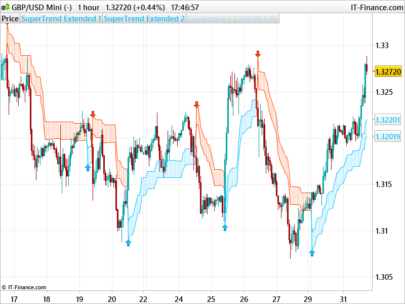
A different approach to SuperTrend:
adding 100 periods Exponential Moving Average in calculation of SuperTrend and also 0.5 ATR Multiplier to have a clear view of the ongoing trend and also provides significant Supports and Resistances.
Default Moving Average type set as EMA (Exponential Moving Average) but users can choose from 11 different Moving Average types as:
SMA : Simple Moving Average
EMA : Exponential Moving Average
WMA : Weighted Moving Average
DEMA : Double Exponential Moving Average
TMA : Triangular Moving Average
VAR : Variable Index Dynamic Moving Average a.k.a. VIDYA
WWMA : Welles Wilder’s Moving Average
ZLEMA : Zero Lag Exponential Moving Average
TSF : True Strength Force
HULL : Hull Moving Average
TILL : Tillson T3 Moving Average
(description from author KivancOzbilgic)
|
1 2 3 4 5 6 7 8 9 10 11 12 13 14 15 16 17 18 19 20 21 22 23 24 25 26 27 28 29 30 31 32 33 34 35 36 37 38 39 40 41 42 43 44 45 46 47 48 49 50 51 52 53 54 55 56 57 58 59 60 61 62 63 64 65 66 67 68 69 70 71 72 73 74 75 76 77 78 79 80 81 82 83 84 85 86 87 88 89 90 91 92 93 94 95 96 97 98 99 100 101 102 103 104 105 106 107 108 109 110 111 112 113 114 115 116 117 118 119 120 121 122 123 124 125 126 127 128 129 130 131 132 133 134 135 136 137 138 139 140 141 142 143 144 145 |
src = Close //Data type mav = 1 //Moving Average Value: 0=SMA, 1=EMA, 2=WMA, 3=DEMA, 4=TMA, 5=VAR, 6=WWMA, 7=ZLEMA, 8=TSF, 9=HMA, 10=T3 length = 100 //Moving Average Length Periods = 10 //ATR period Multiplier = 0.5 //ATR Multiplier T3a1 = 0.7 //Tillson T3 Volume Factor valpha = 2 / (length+1) If src > src[1] then //Green candle vud1 = src - src[1] //Green profit else vud1 = 0 EndIf If src < src[1] then //Red candle vdd1 = src[1] - src //Red Loss else vdd1=0 EndIf vUD = Summation[9](vud1) //Summation [9] Green profit vDD = Summation[9](vdd1) //Summation [9] Red Loss vCMO = ((vUD - vDD) / vUD + vDD) //Cumulative Market Oscillator Once VAR = 0 VAR = (valpha * Abs(vCMO) * src) + (1 - valpha * Abs(vCMO)) * VAR[1] xDEMA = 2 * ExponentialAverage[length](src) - ExponentialAverage[length](ExponentialAverage[length](src)) wwalpha = 1 //Length Once WWMA = 0 WWMA = wwalpha * src + (1 - wwalpha) * WWMA[1] If (length / 2) = Round(length / 2) then //Check even/odd length for "zero lag" zxLag = (length / 2) Else zxLag = ((length-1) / 2) EndIf zxEMAData = src + src - src[zxLag] xZLEMA = ExponentialAverage[length](zxEMAData) //Zero Lag Exponential Average lrc = LinearRegression[length](src) lrc1 = lrc[1] lrs = lrc - lrc1 TSF = LinearRegression[length](src) + lrs //Time Series Forecast HMA = WeightedAverage[Round(SQRT(length))](2 * WeightedAverage[length/2](src) - WeightedAverage[length](src)) //Hull Moving Average T3e1 = ExponentialAverage[length](src) T3e2 = ExponentialAverage[length](T3e1) T3e3 = ExponentialAverage[length](T3e2) T3e4 = ExponentialAverage[length](T3e3) T3e5 = ExponentialAverage[length](T3e4) T3e6 = ExponentialAverage[length](T3e5) T3c1 = -T3a1 * T3a1 * T3a1 T3c2 = 3 * T3a1 * T3a1 + 3 * T3a1 * T3a1 * T3a1 T3c3 = -6 * T3a1 * T3a1 - 3 * T3a1 - 3 * T3a1 * T3a1 * T3a1 T3c4 = 1 + 3 * T3a1 + T3a1 * T3a1 * T3a1 + 3 * T3a1 * T3a1 T3 = T3c1 * T3e6 + T3c2 * T3e5 + T3c3 * T3e4 + T3c4 * T3e3 //T3 Moving Average Once MA = 0 If mav = 0 then MA = Average[length,0](src) //SMA ElsIf mav = 1 then MA = Average[length,1](src) //EMA ElsIf mav = 2 then MA = Average[length,2](src) //WEMA ElsIf mav = 3 then MA = xDEMA //DEMA ElsIf mav = 4 then MA = Average[Floor(length / 2) + 1](Average[Ceil(length / 2)](src)) //TMA ElsIf mav = 5 then MA = VAR //VAR a.k.a. VIDYA Variable Index Dynamic Moving Average ElsIf mav = 6 then MA = WWMA //WWMA Welles Wilder's Moving Average ElsIf mav = 7 then MA = xZLEMA //ZLEMA Zero Lag Exponential Moving Average ElsIf mav = 8 then MA = TSF //TSF Time Series Forecast ElsIf mav = 9 then MA = HMA //HMA Hull Moving Average ElsIf mav = 10 then MA = T3 //T3 Tillson Moving Average EndIf atr = AverageTrueRange[Periods](src) up = MA - Multiplier * atr up1 = up[1] If src[1] > up1 then up = Max(up, up1) Else up = up EndIf dn = MA + Multiplier * atr dn1 = dn[1] If src[1] < dn1 then dn = Min(dn, dn1) else dn = dn EndIf Once trend = 1 If trend = -1 and Close > dn1 then trend = 1 ElsIf trend = 1 and Close < up1 then trend = -1 EndIf If trend = 1 then upR=0 upG=255 upB=0 upAlpha=0 Else upR=0 upG=0 upB=0 upAlpha=0 EndIf //If Close > up then //ColorBetween(Close,up,0,255,0) //EndIf If trend = -1 then dnR=255 dnG=0 dnB=0 dnAlpha=0 else dnR=0 dnG=0 dnB=0 dnAlpha=0 EndIf //If Close < dn then //ColorBetween(Close,dn,255,0,0) //EndIf Return up as "Up Trend" coloured(upR,upG,upB,upAlpha), dn as "Down Trend" coloured(dnR,dnG,dnB, dnAlpha) |
Share this
No information on this site is investment advice or a solicitation to buy or sell any financial instrument. Past performance is not indicative of future results. Trading may expose you to risk of loss greater than your deposits and is only suitable for experienced investors who have sufficient financial means to bear such risk.
ProRealTime ITF files and other attachments :PRC is also on YouTube, subscribe to our channel for exclusive content and tutorials
