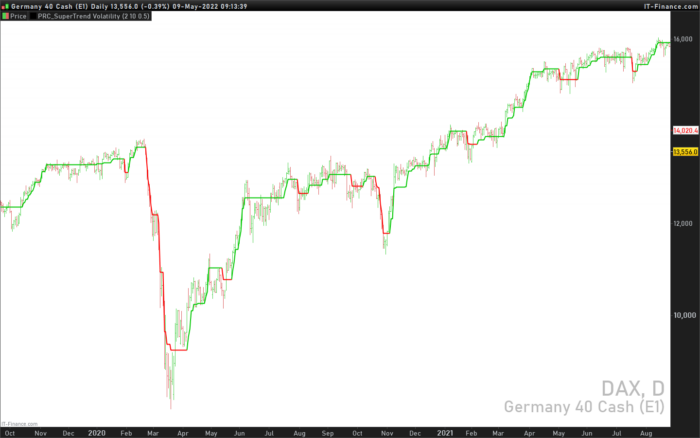
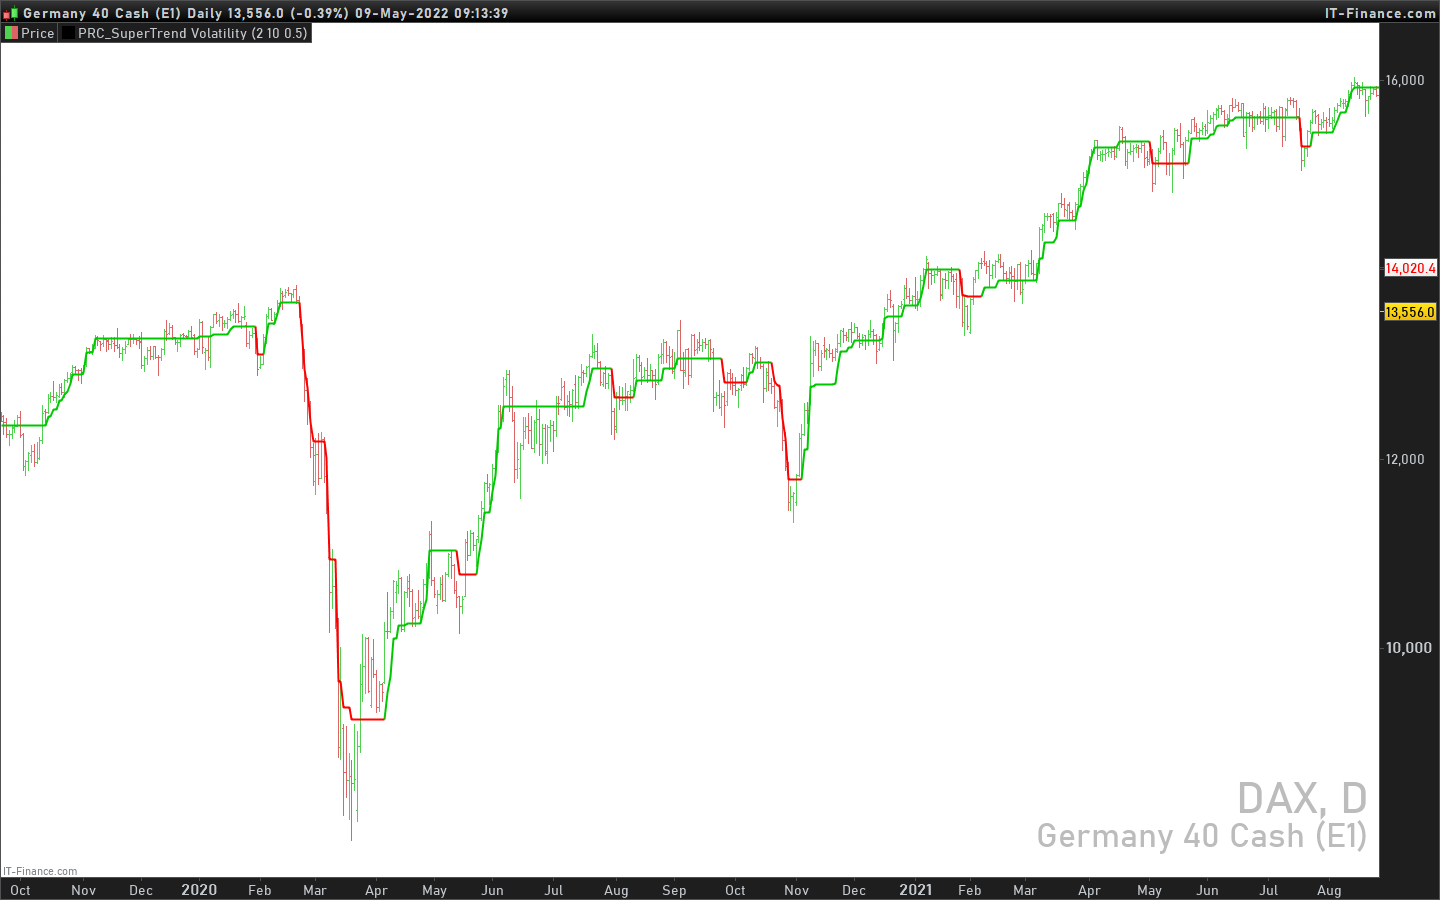
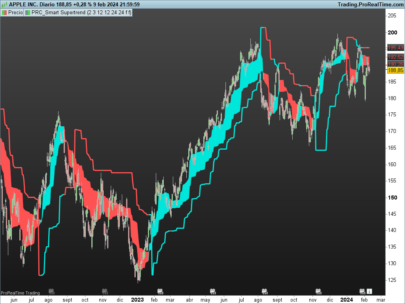
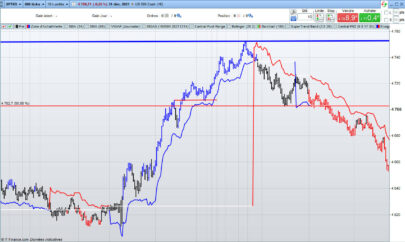
This indicator is actually composition of 3 indicator to one common one
it based on super trend , OBV and volatility % range
obv act as our source for the super trend to make it more sensitive
you can control it as a regular super trend + the addition of volatility % range ( volatility factor)
so 1 is volatility range , can be from 0.1 to 5 depend on your liking.
i set it here in this example of btc 4 hour chart to be 0.5 which is 1/2 of the volatility % range since it fitted better this particular asset . for stock i prefer 1 as my factor
this indicator as i normally do have alert and signal inside.
the aim of this indicator is to maximize trend on one hand and other to keep sensitivity high
one of the problem with regular super trend that as we keep the we increase the trend to be longer it lose sensitivity .
by this method that i show here i try to minimize that bad effect and make it both sensitive and more responsive. this is one of the reason i use a modified version of OBV as a source to it .
for each asset that you use try to find the best fit so this model can work properly
(description of original author: RafaelZioni)
|
1 2 3 4 5 6 7 8 9 10 11 12 13 14 15 16 17 18 19 20 21 22 23 24 25 26 27 28 29 30 31 32 33 34 35 36 37 38 39 40 41 42 43 44 45 46 47 48 49 50 51 52 53 54 55 56 57 58 59 60 61 62 63 64 65 66 67 68 69 70 71 72 73 74 75 76 77 78 79 80 81 82 83 84 85 86 87 88 89 90 91 92 93 94 95 96 97 98 99 100 101 102 103 104 105 106 107 108 109 110 111 112 113 114 |
//PRC_SuperTrend Volatility | indicator //09.05.2022 //Nicolas @ www.prorealcode.com //Sharing ProRealTime knowledge //converted from pinescript // --- settings //stmult = 2 //Trend Multiplier minval = 0, maxval = 100, step = 0.01 //stperiod = 10 //Trend Period //factor = 0.5 //Volatility Factor minval=0.1, maxval=5 // --- end of settings if barindex>28 then hilow = max(pointsize,((high - low)*100)) openclose = ((close - open)*100) if volume<>volume[1] then if close>close[1] then myobv=myobv+volume elsif close<close[1] then myobv=myobv-volume endif endif vol = (myobv / hilow) spreadvol = (openclose * vol) VPT = spreadvol + cumsum(spreadvol) once windowlen = 28 once vlen = 14 pricespread = std[windowlen](range) vx = spreadvol + cumsum(spreadvol) smooth = average[vlen,1](vx) vspread = std[windowlen](vx - smooth) shadow = (vx - smooth) / vspread * pricespread if shadow > 0 then out = high + shadow else out = low + shadow endif // CALCULATIONS // uplev =out - (stmult * averagetruerange[stperiod]) dnlev = out + (stmult * averagetruerange[stperiod]) // iVolatility = 100 * summation[1](100 * averagetruerange[1] / low) / 100 perc = (iVolatility*0.01) *factor c=barindex n = dnlev x =uplev once lb = n once hb = x once l1 = out once hl = out if c = 0 then if x >= hb[1] then hb = x hl = out trend = 1 else lb = n l1 = out trend = -1 endif endif if c > 1 then if trend[1] > 0 then hl = max(hl[1], out) if x >= hb[1] then hb = x else if n < hb[1] - hb[1] * perc then lb = n l1 = out trend = -1 endif endif else l1 = min(l1[1], out ) if n <= lb[1] then lb = n else if x > lb[1] + lb[1] * perc then hb = x hl = out trend = 1 endif endif endif endif if trend = 1 then v = hb r=0 g=200 elsif trend = -1 then v = lb r=255 g=0 endif endif return v style(line,2) coloured(r,g,0) |
Share this
No information on this site is investment advice or a solicitation to buy or sell any financial instrument. Past performance is not indicative of future results. Trading may expose you to risk of loss greater than your deposits and is only suitable for experienced investors who have sufficient financial means to bear such risk.
ProRealTime ITF files and other attachments :PRC is also on YouTube, subscribe to our channel for exclusive content and tutorials






Thanks so much for your great help!
May I ask you for further favor? Can you show me how to translate this indicator to a screener to indicate which stock fulfill the BUY/SELL signal?
i.e. based on the following part of the original script
long = trend == 1 and trend[1] == -1
short = trend == -1 and trend[1] == 1
//
last_long = 0.0
last_short = 0.0
last_long := long ? time : nz(last_long[1])
last_short := short ? time : nz(last_short[1])
buy = crossover(last_long, last_short)
sell = crossover(last_short, last_long)
Buongiorno Nicolas, vorrei provare questo indicatore, ma quando lo inserisco in PRT mi vengono solo righe orizzontali e mi sparisce il grafico. C’è qualche cosa che va modificato per poterlo ottenere come nella foto qui in alto? Mille grazie.
Basta aggiungerlo al prezzo
https://www.prorealcode.com/blog/video-tutorials/how-to-add-an-indicator-on-price-prorealtime/
hello Nicolas,
this indicator works with the last Beta version of PRT? Ive seen tha many indicators made in the last two years are not compatible