We know that some popular indicators are supportive and resistant.
We have the most widespread moving averages, namely MM20 – MM50 – MM100 – MM200 of Simple Type
Also Ichimoku, this indicator was designed to give levels of support and resistance.
If you apply all these indicators on the same chart, your vision will be distorted by too many lines, especially if you want to add the pivot points .
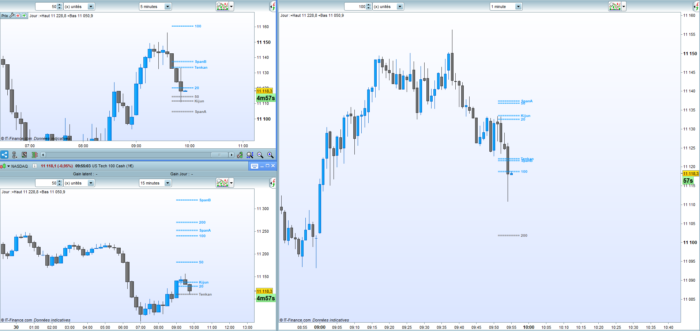
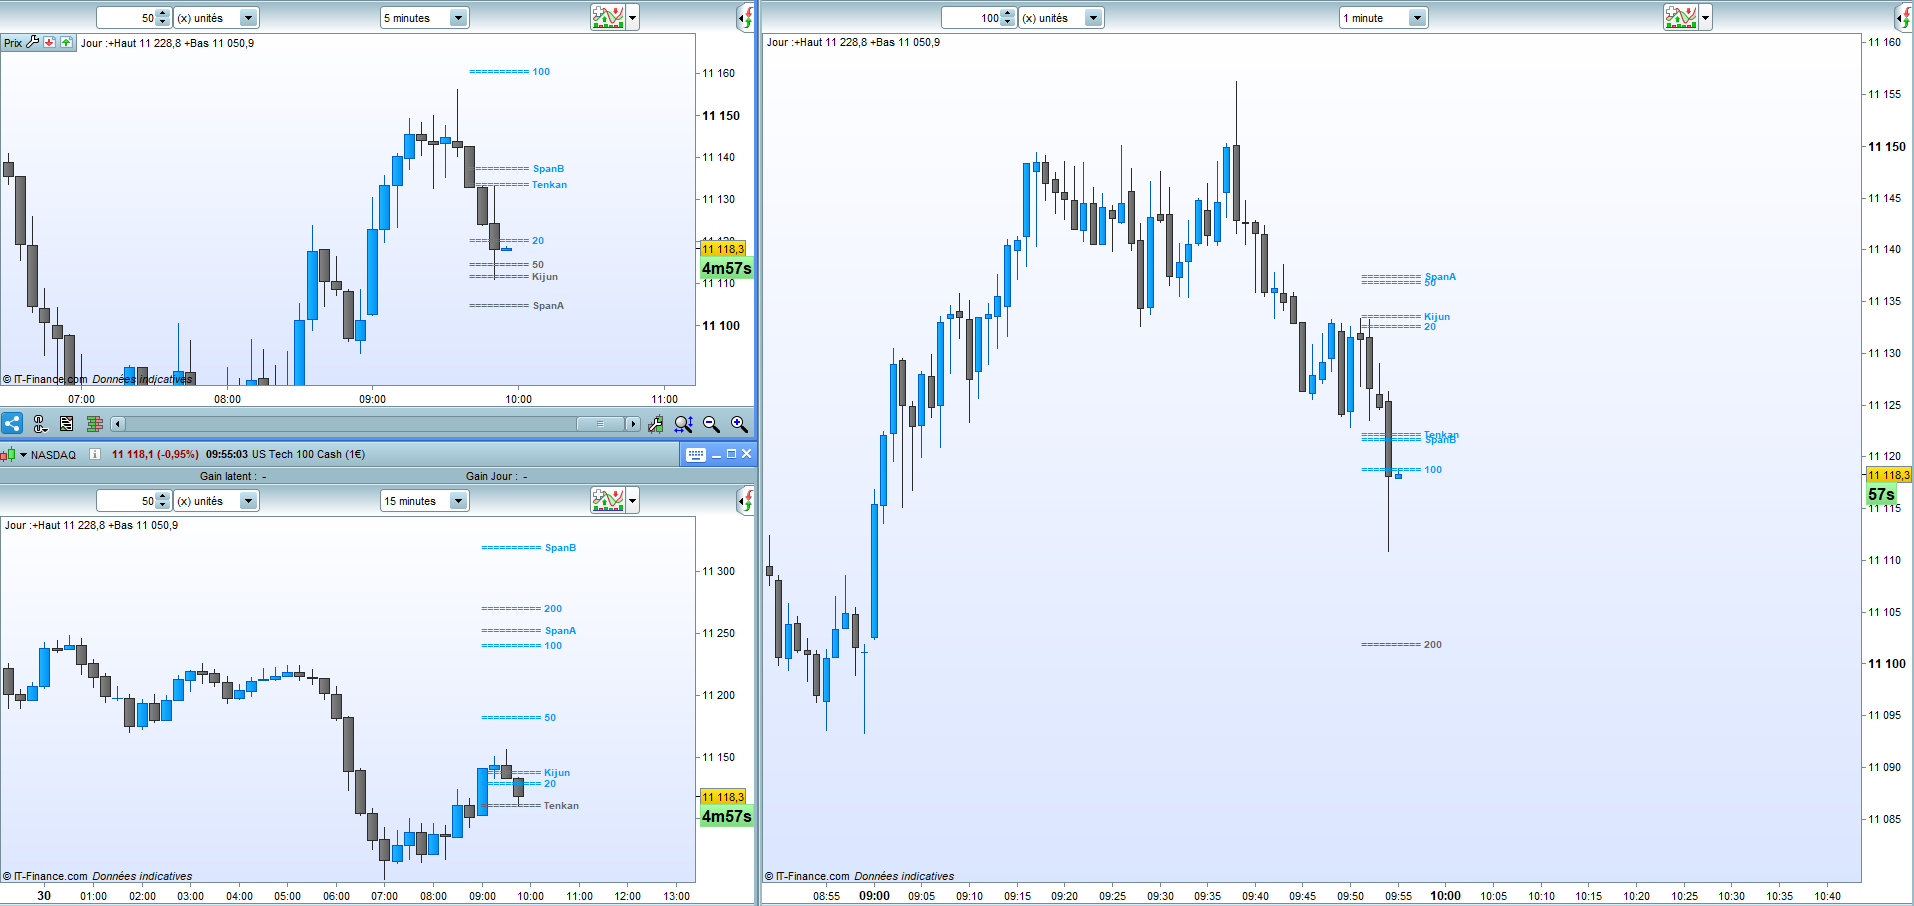
So I have coded this small indicator that groups together the current levels of all the components mentioned above for more comfort.
You can activate or deactivate a component as an external variable.
IV
|
1 2 3 4 5 6 7 8 9 10 11 12 13 14 15 16 17 18 19 20 21 22 23 24 25 26 27 28 29 30 31 32 33 34 35 36 37 38 39 40 41 42 43 44 45 46 47 48 49 50 51 52 53 54 55 56 57 58 59 60 61 62 63 64 65 66 67 68 69 70 71 72 73 74 75 76 77 78 79 80 81 82 83 84 85 86 87 88 89 90 91 92 93 94 95 96 97 98 99 100 101 102 103 104 105 106 107 108 109 110 111 112 113 114 115 116 117 118 119 120 121 122 123 124 125 126 127 128 129 130 131 132 133 134 135 136 137 138 139 140 141 142 143 144 145 146 147 148 149 150 151 152 153 154 155 156 157 158 159 160 161 162 163 164 165 166 167 168 169 |
// //=/===============/=//=/===============/=//=/ Indicator Support & Resistance // defparam drawonlastbaronly = true //MM20 = 1 //MM50 = 1 //MM100 = 1 //MM200 = 1 //SSA = 1 //SSB = 1 //Tenkansen = 1 //Kijunsen = 1 // //=/===============/=//=/===============/=//=/ Support Resistance // //=/ Support 20 if MM20 then S20 = average[20](close) drawtext("========== 20",barindex,S20,Dialog,Bold,10) coloured (RS20,GS20,BS20) endif if close > S20 then RS20 = 102 GS20 = 102 BS20 = 102 elsif close < S20 then RS20 = 0 GS20 = 153 BS20 = 255 endif //=/ Support 50 if MM50 then S50 = average[50](close) drawtext("========== 50",barindex,S50,Dialog,Bold,10) coloured (RS50,GS50,BS50) endif if close > S50 then RS50 = 102 GS50 = 102 BS50 = 102 elsif close < S50 then RS50 = 0 GS50 = 153 BS50 = 255 endif //=/ Support 100 if MM100 then S100 = average[100](close) drawtext(" ========== 100",barindex,S100,Dialog,Bold,10) coloured (RS100,GS100,BS100) endif if close > S100 then RS100 = 102 GS100 = 102 BS100 = 102 elsif close < S100 then RS100 = 0 GS100 = 153 BS100 = 255 endif //=/ Support 200 if MM200 then S200 = average[200](close) drawtext(" ========== 200",barindex,S200,Dialog,Bold,10) coloured (RS200,GS200,BS200) endif if close > S200 then RS200 = 102 GS200 = 102 BS200 = 102 elsif close < S200 then RS200 = 0 GS200 = 153 BS200 = 255 endif //=/ SpanA if SSA then SpanA = (Tenkan[26]+Kijun[26])/2 drawtext(" ========== SpanA",barindex,SpanA,Dialog,Bold,10) coloured (RSpanA,GSpanA,BSpanA) endif if close > SpanA then RSpanA = 102 GSpanA = 102 BSpanA = 102 elsif close < SpanA then RSpanA = 0 GSpanA = 153 BSpanA = 255 endif //=/ Tenkan if Tenkansen then Tenkan = (highest[9](high)+lowest[9](low))/2 drawtext(" ========== Tenkan",barindex,Tenkan,Dialog,Bold,10) coloured (RTenkan,GTenkan,BTenkan) endif if close > Tenkan then RTenkan = 102 GTenkan = 102 BTenkan = 102 elsif close < Tenkan then RTenkan = 0 GTenkan = 153 BTenkan = 255 endif //=/ Kijun if Kijunsen then Kijun = (highest[26](high)+lowest[26](low))/2 drawtext(" ========== Kijun",barindex,Kijun,Dialog,Bold,10) coloured (RKijun,GKijun,BKijun) endif if close > Kijun then RKijun = 102 GKijun = 102 BKijun = 102 elsif close < Kijun then RKijun = 0 GKijun = 153 BKijun = 255 endif //=/ SpanB if SSB then SpanB = (highest[52](high[26])+lowest[52](low[26]))/2 drawtext(" ========== SpanB",barindex,SpanB,Dialog,Bold,10) coloured (RSpanB,GSpanB,BSpanB) endif if close > SpanB then RSpanB = 102 GSpanB = 102 BSpanB = 102 elsif close < SpanB then RSpanB = 0 GSpanB = 153 BSpanB = 255 endif // //=/===============/=//=/===============/=//=/ End // return |
Share this
No information on this site is investment advice or a solicitation to buy or sell any financial instrument. Past performance is not indicative of future results. Trading may expose you to risk of loss greater than your deposits and is only suitable for experienced investors who have sufficient financial means to bear such risk.
ProRealTime ITF files and other attachments :PRC is also on YouTube, subscribe to our channel for exclusive content and tutorials










How do i attach this indicator to my mt5 platform?
You can’t! All indicators here are for ProRealTime trading platform: https://www.prorealtime.com