







Sweet Spots - round numbers
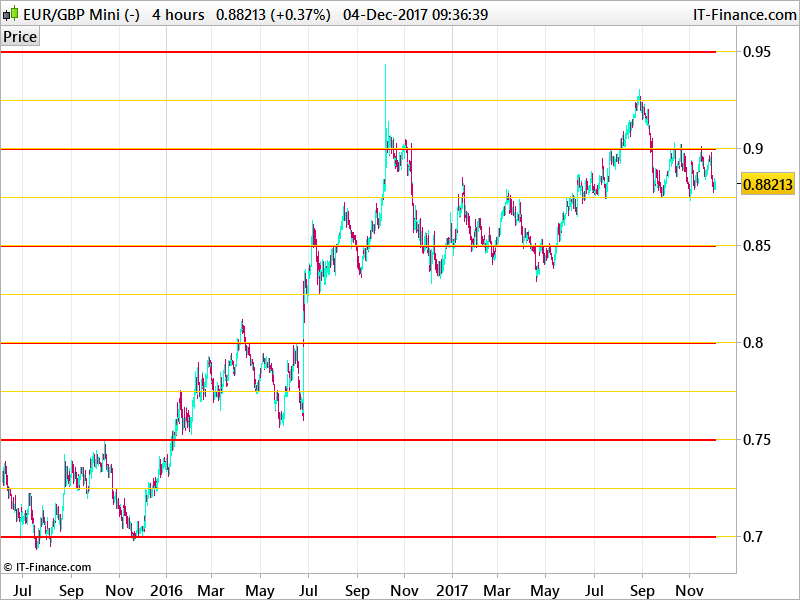
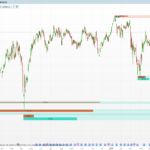
The SweetSpots indicator plots automatically lines on round price rates, not only double zeros, it includes any round numbers calculated with 2 different settings in parameters:
- MainLevels (define major levels, define this setting in points/pips, it will automatically adapt the calculation for the current security/instrument)
- SubLevels (define sub levels, same setting as MainLevels one)
The ‘NumLinesAboveBelow’ setting will determine how much levels will be plotted on the chart (default is 100 lines above and below the current Close).
//PRC_SweetSpots round number | indicator
//04.12.2017
//Nicolas @ www.prorealcode.com
//Sharing ProRealTime knowledge

// --- settings
// NumLinesAboveBelow = 100
// MainLevels = 100
// SubLevels = 20
// --- end of settings

defparam drawonlastbaronly=true

DecAr = MainLevels*pointsize
DecArSub = SubLevels*pointsize

myVarUp = close
myVarDn = close
myVarUpSub = close
myVarDnSub = close

if DecAr = 0 then
 InvDec = 1
else
 InvDec = 1/DecAr
endif
if DecArSub = 0 then
 InvDecSub = 1
else
 InvDecSub = 1/DecArSub
endif

for i = 0 to NumLinesAboveBelow do

 Floor = round(InvDec*myVarDn-0.51)/InvDec
 Ceil = round(InvDec*myVarUp+0.51)/InvDec

 FloorSub = round(InvDecSub*myVarDnSub-0.51)/InvDecSub
 CeilSub = round(InvDecSub*myVarUpSub+0.51)/InvDecSub

 r=255
 g=215
 floorval=floorsub
 ceilval=ceilsub

 drawhline(floorval) coloured(r,g,0)
 drawhline(ceilval) coloured(r,g,0)
 drawrectangle(1,floor,barindex,floor) coloured(r,0,0)
 drawrectangle(1,ceil,barindex,ceil) coloured(r,0,0)

 myVarUp=Ceil
 myVarDn=Floor
 myVarUpSub=CeilSub
 myVarDnSub=FloorSub

next

return
Comments
You must be logged in to post a comment.

I am using this indicator but it keep crashing as i change the timeframe. For example, changing from 1 Min to 5 minute. Each time I change timeframe, I need to reload this indicator. The error gives "calculation error". I load only 5 lines, yet this keeps crashing. What could be the issue? thanks



Hi, Nicholas I find your sweetspot indicator very handy for identifying key areas in a range of markets, and I would like to incorporate what I think are important levels into my own programmes. Is it possible to reference these lines either in this or a similar programme by attributing variable names to them directly ? Thank you very much for your help and time.

Hi Nicolas, thanks a lot for posting this, very useful. A quick question, I havent much experience with coding but was wondering how I could go about changing the colour of the lines as well as the thickness of the lines? Also, is it possible to put a label on the lines? Thanks Andrew
Is it possible to have an indicator where those value are as instogram ? and separated? in order to obtain them for a strategy?