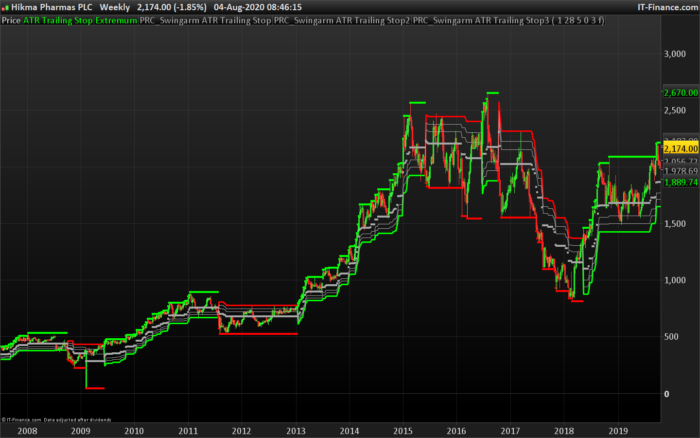
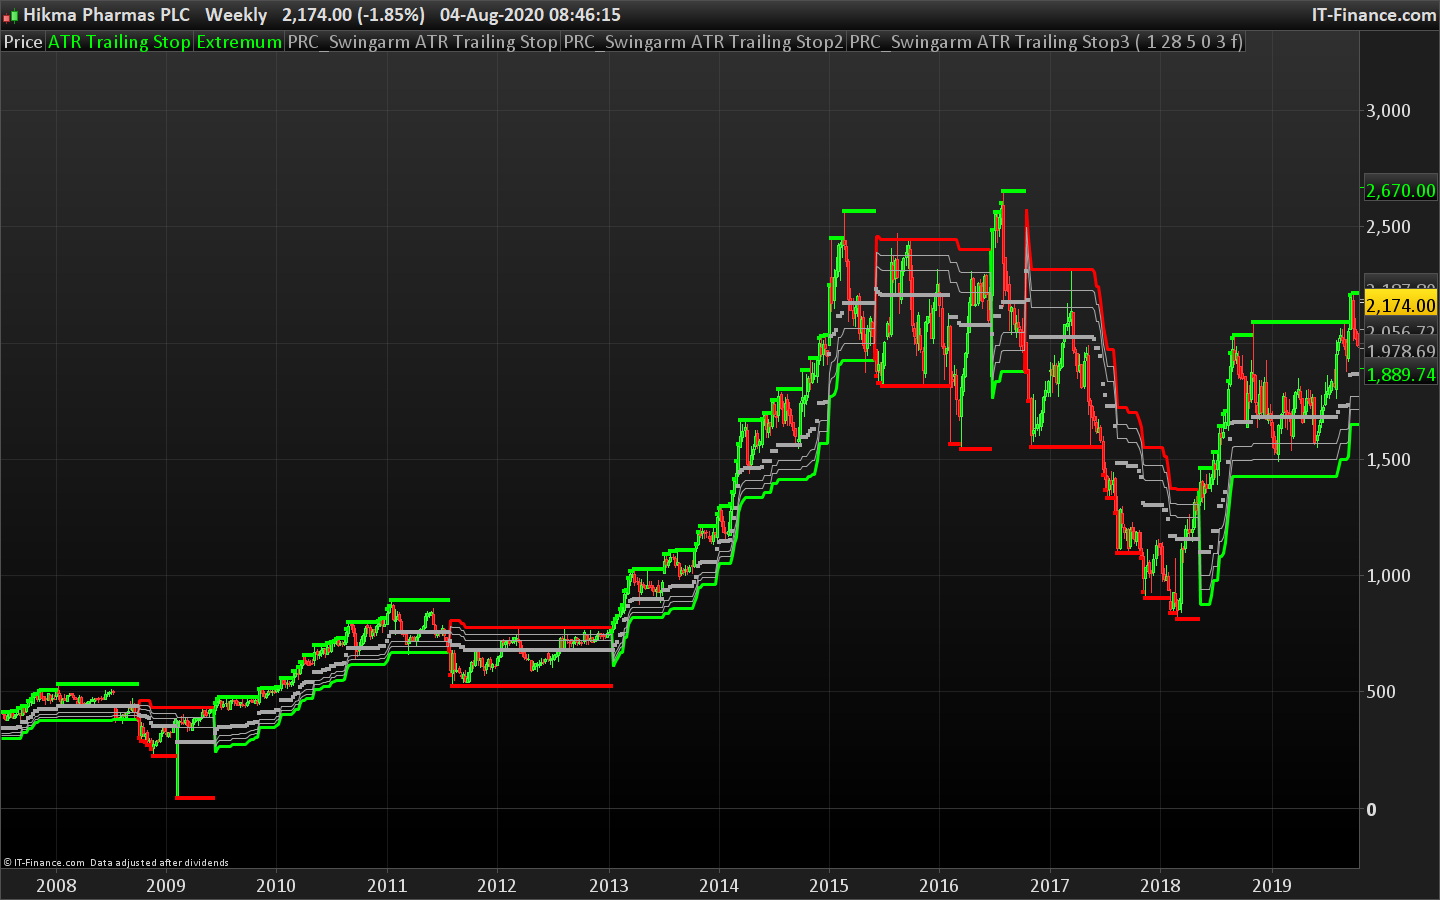
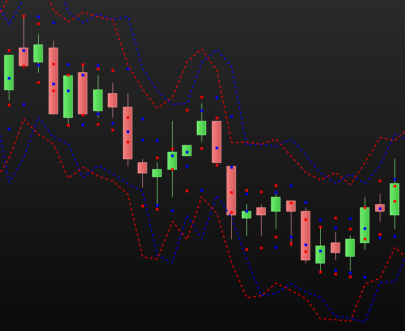
As a trend following indicator, the Swing ARM can be used as a trailing stop. It provides trend change confirmation when the price Close above or below the current trailing line.
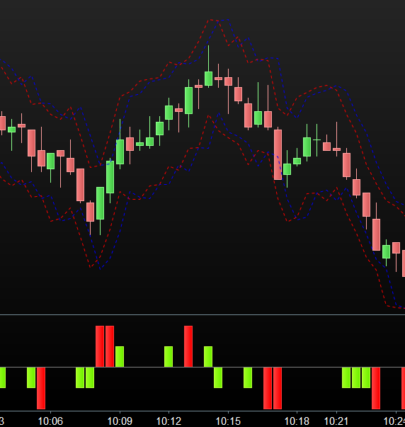
It plots Fibonacci retracement around the trailing stop trend line, it provides good entry points when the price retraces in a well established trend.
The SwingArm is using the ATRTrailingStop and modifying it to have FIB Retracements into it.
It can be used on any timeframe. The best for me (day trading) is the 10-minute chart. For Swing Trading, the 4 hours chart works well. (notes from Author).
Original Author: Jose Azcarate
The code has been translated from ToS code following a request in the indicator forum.
|
1 2 3 4 5 6 7 8 9 10 11 12 13 14 15 16 17 18 19 20 21 22 23 24 25 26 27 28 29 30 31 32 33 34 35 36 37 38 39 40 41 42 43 44 45 46 47 48 49 50 51 52 53 54 55 56 57 58 59 60 61 62 63 64 65 66 67 68 69 70 71 72 73 74 75 76 77 78 79 80 81 82 83 84 85 86 87 88 89 90 91 92 93 94 95 96 97 98 99 100 101 102 103 104 105 106 107 108 109 110 111 112 113 114 115 116 117 118 119 120 121 122 123 124 125 126 127 128 129 130 131 132 133 134 135 136 |
//PRC_Swingarm ATR Trailing Stop | indicator //03.08.2020 //Nicolas @ www.prorealcode.com //Sharing ProRealTime knowledge //converted from TOS //Author: Jose Azcarate //https://www.prorealcode.com/topic/conversion-of-swingarm-atr-trailing-stop/ // --- settings trailType = 1 //1=modified, 0=unmodified ATRPeriod = 28 ATRFactor = 5 firstTrade = 0 //0= long, 1= short averageType = 3 //0 = SMA 1 = EMA 2 = WMA 3 = Wilder 4 = Triangular 5 = End point 6 = Time series 7 = Hull (PRT v11 only) 8 = ZeroLag (PRT v11 only) showArrows = 0 //0=false ; 1=true //--- end of settings fib1Level = 61.8 fib2Level = 78.6 fib3Level = 88.6 HiLo = Min(high - low, 1.5 * Average[ATRPeriod](range)) if low <= high[1] then Href = high - close[1] else Href = (high - close[1]) - 0.5 * (low - high[1]) endif if high >= low[1] then Lref = close[1] - low else Lref = (close[1] - low) - 0.5 * (low[1] - high) endif //case modified: if trailType = 1 then trueRange = Max(HiLo, Max(HRef, LRef)) else //case unmodified trueRange = tr(close) // TrueRange(high, close, low) endif iloss = ATRFactor * Average[ATRPeriod,averageType](trueRange) once init=0 if init=0 then if firsttrade=0 then state = 0 trail = close - iloss else state = 1 trail = close + iloss endif init=1 endif //case long: if state[1] = 0 then if (close > trail[1]) then state = 0 trail = Max(trail[1], close - iloss) else state = 1 trail = close + iloss endif endif //case short: if state[1] = 1 then if (close < trail[1]) then state = 1 trail = Min(trail[1], close + iloss) else state = 0 trail = close - iloss endif endif BuySignal = state<>state[1] and state = 0 SellSignal = state<>state[1] and state = 1 if BuySignal then ex = high elsif SellSignal then ex = low else if state = 0 then ex = Max(ex[1], high) elsif state = 1 then ex = Min(ex[1], low) else ex = ex[1] endif endif TrailingStop = trail if state = 0 then r=0 g=255 else r=255 g=0 endif f1 = ex + (trail - ex) * fib1Level / 100 f2 = ex + (trail - ex) * fib2Level / 100 f3 = ex + (trail - ex) * fib3Level / 100 if showArrows then l1 = state[1] = 0 and close crosses under f1[1] l2 = state[1] = 0 and close crosses under f2[1] l3 = state[1] = 0 and close crosses under f3[1] s1 = state[1] = 1 and close crosses over f1[1] s2 = state[1] = 1 and close crosses over f2[1] s3 = state[1] = 1 and close crosses over f3[1] atr = AverageTrueRange[14](close) y=0 if l1 or l2 or l3 then y =low - atr endif if s1 or s2 or s3 then y=high + atr endif if y>0 then if y>close then drawarrowdown(barindex,y) coloured(r,g,0) else drawarrowup(barindex,y) coloured(r,g,0) endif endif endif return TrailingStop coloured(r,g,0) style(line,3) as "ATR Trailing Stop" , ex coloured(r,g,0) style(point,4) as "Extremum", f1 coloured(168,168,168), f2 coloured(168,168,168), f3 coloured(168,168,168) |
Share this
No information on this site is investment advice or a solicitation to buy or sell any financial instrument. Past performance is not indicative of future results. Trading may expose you to risk of loss greater than your deposits and is only suitable for experienced investors who have sufficient financial means to bear such risk.
ProRealTime ITF files and other attachments :PRC is also on YouTube, subscribe to our channel for exclusive content and tutorials





bonjour Nicolas merci pour tous ces itf. J’utilsie une stratégie qui dépend d’un niveau de 50% de la bougie précédente pour prendre position. est il possible de programmer un itf permettant de visualiser une barre à chaque moitié de bougie. La couleur pouvant etre changée en fonction du code couleur de bougie de chacun.merci bien.
Oui c’est possible. Merci de ne pas poster des demandes qui sont hors sujets. Pour les demandes de programmation, il faut utiliser les forums en respectant les règles de publication énoncées à chaque bas de page.
Merci pour cet itf. Question : comment faire pour instruire un screener ?
tester le croisement du Close avec la première valeur de l’indicateur : “TrailingStop”, facile avec la création assistée.