







T3 Velocity
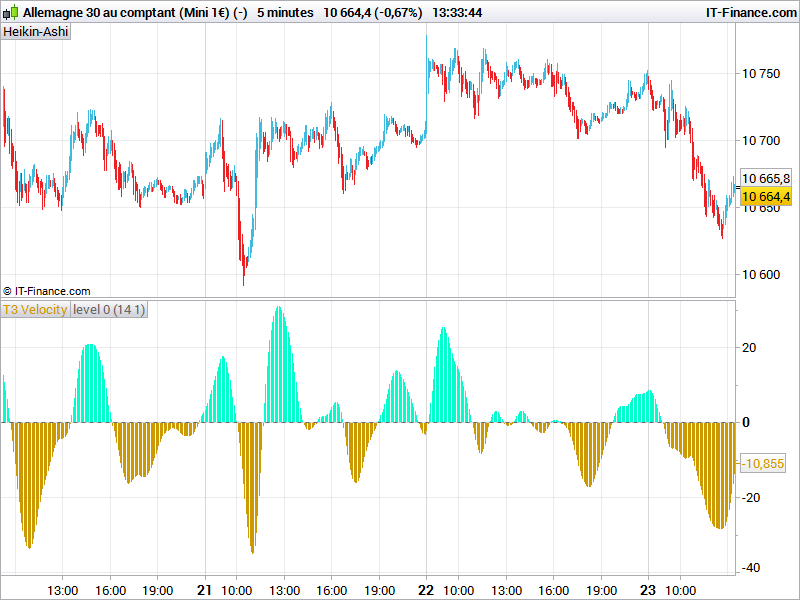
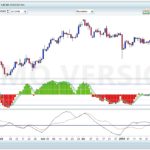
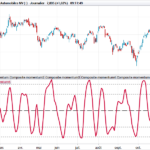
This technical indicator is a kind of rate of change oscillator made of 2 T3 moving average. It compares the momentum of the 2 curves between the current and the previous period. The first curve is calculated upon the period and the complete factor (“vFactor” parameter) and the second one with an half of this factor.
It results a smoothed oscillator that can be traded almost like a MACD. An optional signal line could be added to give clear entries when the oscillator cross it.
//PRC_T2 Velocity | indicator
//23.11.2016
//Nicolas @ www.prorealcode.com
//Sharing ProRealTime knowledge
//converted and adapted from Metatrader5 version

// --- parameters
//period= 14
//vfactor=1.0

Data=customclose

x1=(exponentialaverage[period](Data))*(1+vfactor)
x2=(exponentialaverage[period](exponentialaverage[period](Data)))*vfactor
gd=x1-x2
x11=(exponentialaverage[period](gd))*(1+vfactor)
x21=(exponentialaverage[period](exponentialaverage[period](gd)))*vfactor
gd1=x11-x21
x12=(exponentialaverage[period](gd1))*(1+vfactor)
x22=(exponentialaverage[period](exponentialaverage[period](gd1)))*vfactor
first=x12-x22

y1=(exponentialaverage[period](Data))*(1+vfactor/2)
y2=(exponentialaverage[period](exponentialaverage[period](Data)))*vfactor/2
ygd=y1-y2
y11=(exponentialaverage[period](ygd))*(1+vfactor/2)
y21=(exponentialaverage[period](exponentialaverage[period](ygd)))*vfactor/2
ygd1=y11-y21
y12=(exponentialaverage[period](ygd1))*(1+vfactor/2)
y22=(exponentialaverage[period](exponentialaverage[period](ygd1)))*vfactor/2
second=y12-y22

S = first - second[1]

return S as "T3 Velocity", 0 as "level 0"
Comments
You must be logged in to post a comment.

As you can do to set a marker directly in the price property page and then view it such as moving averages, because I add with the button "add marker" in property price and then see it in the description on the list but do not see it in the chart
I'm sorry but I can not insert image!
Hello Nicolas wanted to ask you a few things, I tried to change its T3 indicator putting in the same table T3
with several periods but I saw that the result is not the same as the single one that I have called period2
with 30 setting has a different path from 'original more than 30 times that you see below (see photo),
could you tell me where I'm wrong. And also I wanted to ask how can I do to color differently
the three indicators and how scripted text (such as photos) with drawtest command. Thank you and good day
//Tracy
period=2
vfactor=.7
Data=customclose
x1=(exponentialaverage[period](Data))*(1+vfactor)
x2=(exponentialaverage[period](exponentialaverage[period](Data)))*vfactor
gd=x1-x2
x11=(exponentialaverage[period](gd))*(1+vfactor)
x21=(exponentialaverage[period](exponentialaverage[period](gd)))*vfactor
gd1=x11-x21
x12=(exponentialaverage[period](gd1))*(1+vfactor)
x22=(exponentialaverage[period](exponentialaverage[period](gd1)))*vfactor
first=x12-x22
y1=(exponentialaverage[period](Data))*(1+vfactor/2)
y2=(exponentialaverage[period](exponentialaverage[period](Data)))*vfactor/2
ygd=y1-y2
y11=(exponentialaverage[period](ygd))*(1+vfactor/2)
y21=(exponentialaverage[period](exponentialaverage[period](ygd)))*vfactor/2
ygd1=y11-y21
y12=(exponentialaverage[period](ygd1))*(1+vfactor/2)
y22=(exponentialaverage[period](exponentialaverage[period](ygd1)))*vfactor/2
second=y12-y22
S = first - second[1]

//T+2
period1=4
vfactor1=0.7
x10=(exponentialaverage[period1](Data))*(1+vfactor1)
x20=(exponentialaverage[period1](exponentialaverage[period1](Data)))*vfactor1
gd2=x10-x20
x110=(exponentialaverage[period1](gd2))*(1+vfactor1)
x210=(exponentialaverage[period1](exponentialaverage[period1](gd2)))*vfactor1
gd20=x110-x210
x120=(exponentialaverage[period1](gd20))*(1+vfactor1)
x220=(exponentialaverage[period1](exponentialaverage[period1](gd20)))*vfactor1
first=x120-x220
y10=(exponentialaverage[period1](Data))*(1+vfactor1/2)
y20=(exponentialaverage[period1](exponentialaverage[period1](Data)))*vfactor1/2
ygd2=y10-y20
y110=(exponentialaverage[period1](ygd2))*(1+vfactor1/2)
y210=(exponentialaverage[period1](exponentialaverage[period1](ygd2)))*vfactor1/2
ygd20=y110-y210
y120=(exponentialaverage[period1](ygd20))*(1+vfactor1/2)
y220=(exponentialaverage[period1](exponentialaverage[period1](ygd20)))*vfactor1/2
second=y120-y220
S1 = first - second[1]


//T+3
period2=30
vfactor2=.7
x100=(exponentialaverage[period2](Data))*(1+vfactor2)
x200=(exponentialaverage[period2](exponentialaverage[period2](Data)))*vfactor2
gd=x100-x200
x1100=(exponentialaverage[period2](gd))*(1+vfactor2)
x2100=(exponentialaverage[period2](exponentialaverage[period](gd)))*vfactor2
gd1=x1100-x2100
x1200=(exponentialaverage[period2](gd1))*(1+vfactor2)
x2200=(exponentialaverage[period2](exponentialaverage[period2](gd1)))*vfactor2
first=x1200-x2200
y100=(exponentialaverage[period2](Data))*(1+vfactor2/2)
y200=(exponentialaverage[period2](exponentialaverage[period2](Data)))*vfactor2/2
ygd=y100-y200
y1100=(exponentialaverage[period2](ygd))*(1+vfactor2/2)
y2100=(exponentialaverage[period2](exponentialaverage[period2](ygd)))*vfactor2/2
ygd1=y1100-y2100
y1200=(exponentialaverage[period2](ygd1))*(1+vfactor2/2)
y2200=(exponentialaverage[period2](exponentialaverage[period2](ygd1)))*vfactor2/2
second=y1200-y2200
S2 = first - second[1]
DRAWTEXT ("Tracy", x1, y1) COLOURED (0,0, 255)
return S2 coloured (256,0,0),  S as "Tracy", 0 as "level 0" ,S1 as "T+2", 0 as "level 0" ,  S2 as "T+3 ", 0 as "level 0"

I would like to know the purpose of the coefficient v factor but also know the meaning of the term T3. Thank you
The T3 moving average is described in the January, 1998 issue of S&C, p.57, "Smoothing Techniques for More Accurate Signals", its author is Tim Tillson. The vfactor is volume factor, which determines how hot the moving average’s response to linear trends will be. The author advises to use v=0.7.
Excuse Mr Nicolas what it means to T3? I could explain what is vfactor

Hi, is this more or less the same as the TTM Squeeze indicator (john carter)