TACBOLSA

TAC Volume Profile Intraday
Category: Indicators By: TACBOLSA Created: March 15, 2019, 10:30 AM
March 15, 2019, 10:30 AM
Indicators
32 Comments
TAC Volume Profile Intraday

From the Idea of the Bull & Bear indicator Volume-by-Price levels

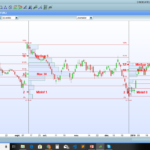
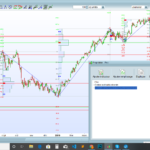
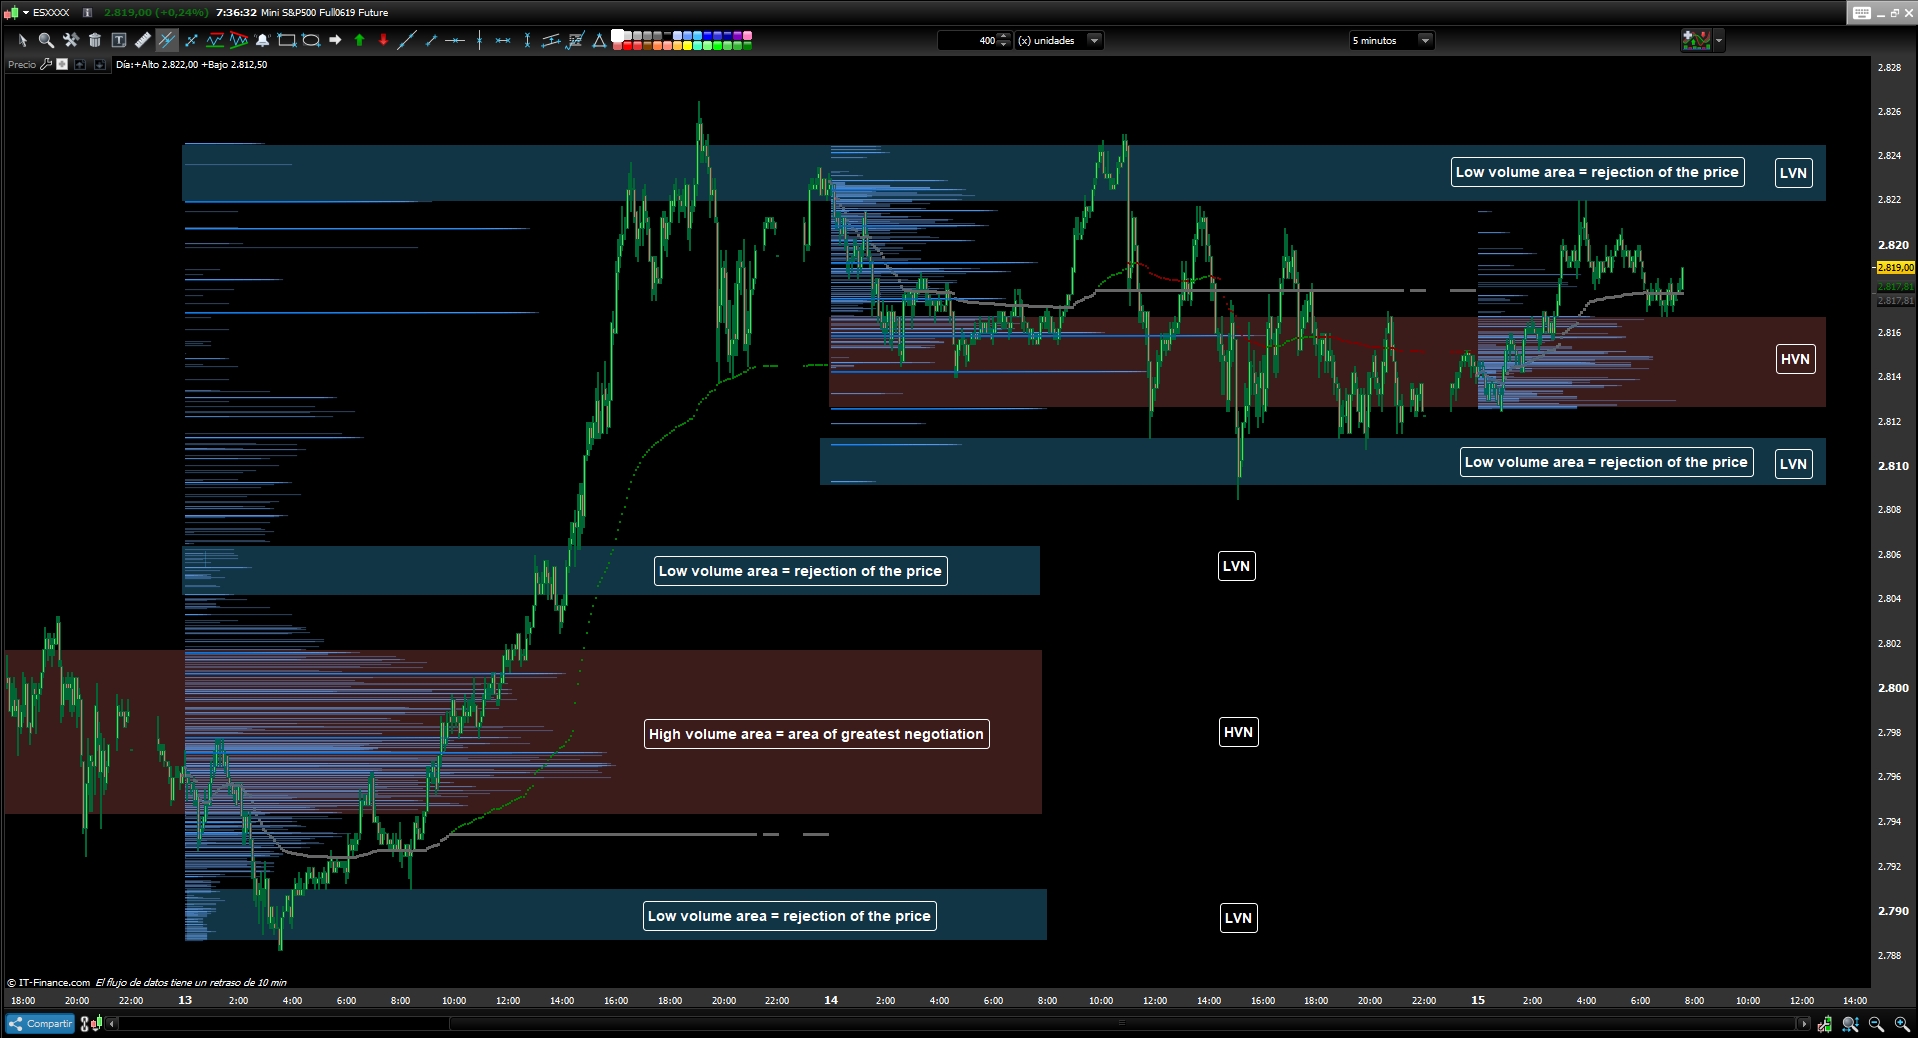
The volume Profile or “volume levels in horizontal” are represented by a two-dimensional axis, between price and volume.

The areas of acceptance (HVN “High Volume Node”) are areas with a high volume there is harmony between supply and demand, bought and sellers.

The areas of rejection (LVN “Low Volume Node”) are areas with very little volume and no acceptance there is no harmony between supply and demand.

HVN: The price spends more time in these levels and higher volume areas.

LVN: The price is rejected by the low volume in these levels serve as supports and resistance.

////Configuration

DPVP : Number of Volume Profiles that we can include, Recommanded (8)

Subasta: Auction : cancel auction

VWAP: Several VWAPs are attached with different temporalities that mark their supports and resistances.
PVP: cancels the profile Volume of the Graph
If subasta=1 then
 b=close > low and volume > high
 ce=close < high and volume > low
 if b or ce then
  volp=volume
 else
  volp=0
 endif
endif
if subasta=0 then
 volp=volume
endif

if intradaybarindex=0 then
 if max(1, intradaybarindex) then
  startbar=barindex
  hh=high
  ll=low
 endif
endif


if high>hh then
 hh = high
 idate = date[DPVP]
endif

if low<ll or ll=0 then
 ll = low
 idate = date[DPVP]
endif

div = (hh-ll)/10
i=0
volsum=summation[300](volp)
while i<10 do
 lrange=ll+div*i
 hrange=lrange+div
 volbull=0
 for j = 1 to 300 do
  if close[j]>=lrange and close[j]<=hrange then
   if close[j]>open[j] then
    volbull=volbull+volp[j]
   else
    volbull=volbull+volp[j]
   endif
  endif
 next

 bullbar = round((volbull*300)/volsum)*2

 if PVP=1 then
  if  today-idate<DPVP then
   drawrectangle(startbar,(hrange+lrange)/2,startbar+bullbar,(hrange+lrange)/2) coloured(0,100,200,20)
  endif
 endif


 i=i+1
wend


//////////////////////////////////////////////////////////
//////////////////////////////////////////////////////////
//////////////////////////////////////////////////////////
//Zone VWWAP

hlc2 = (high+low)/2
if day<>day[1] then
 vwapsum =hlc2*volp
 volumesum=volp
else
 vwapsum= (vwapsum[1]+hlc2*volp)
 volumesum= (volumesum[1]+volp)
endif

myvwap = vwapsum/volumesum

if close>myvwap[1] then
 r=0
 g=128
 b=0
else
 r=128
 g=0
 b=0

endif


starta= Hour>9
pva=hlc2*volp

if starta then
 flaga=1
 startvolp=cumsum(volp)
 startpva=cumsum(pva)
endif

if startvolp=0 then
 demona=1
else
 demona=cumsum(volp)-startvolp
endif
if flaga then
 sr=(cumsum(pva)-startpva)/demona
else
 sr=undefined
endif

if close>sr[1] then
 ra=102
 ga=102
 ba=102
else
 ra=102
 ga=102
 ba=102
endif


If vwap=1 then
 r=r
 g=g
 b=b
 a=255
else
 r=0
 g=128
 b=0
 a=0
endif

if VWAP=1 then
 ra=ra
 ga=ga
 ba=ba
 a=255
else
 r=0
 g=128
 b=0
 a=0
endif


return myvwap coloured (r,g,b,a) style(point,2)  as "CTVWAP Intradia",sr coloured (ra,ga,ba,a) style(point,3) as "VWAP SR Dinamic"


Download
Filename: TAC-Volume-Profile-Intraday.itf
Downloads: 1707
TACBOLSA
TACBOLSA Master
Analista independiente y programador de indicadores.
Author’s Profile

Comments

pmdr1969
4 years ago
#

Hola soy nuevo en en esto. ¿Hay algo parecido pero pudiendo tu elegir las velas a a analizar? Muchas gracias

giumagi
4 years ago
#

Hi Sir, very good job done with this indicator, May I ask you to explain what is the line VWAP SR DINAMIC?

bremze33
4 years ago
#

Another thing. Is it possible to make the graph lines a little thicker and not so long? Because I'm using it in 30min and the Volume is poking into the next days Volume, and the lines are so thin I can't really understand where is any kind of accumulation of Volume. Thanks in advance.

bremze33
4 years ago
#

Hi! I Managed to load the indicator, but it doesn't show up on price chart. It show seperate. How do I fix that it shows on/behind a price chart? Tanks in advance

bremze33
4 years ago
#

Never mind. Found it!

toby.tarczy
6 years ago
#

Hi I manged to load the indicator, great tool. Is there a way to speed up the refresh time on a chart. Taking a long time to load? Many thanks

Anonymous
7 years ago
#

Hi I am new to Pro RealTime platform. The TAC Volume profile is one that I would like to use. I have used it on Metatrader4 and it worked like a charm. The question I have is how do I create a customer indicator with the code above to include this indicator. I am on the latest version of PRT with IB as my broker. Many thanks in advance. I should also mention my trading coach uses TradeView and that is what I would like eventually to have on this platform


marcov66
7 years ago
#

Is there any possibility to plot the PVP? Thanks in advance. Marco

TACBOLSA
7 years ago
#

Hi Proximente will be available in different (VP) https://tiburonesdealetacorta.blogspot.com/2019/11/tac-vp-initial-balance.html

TACBOLSA
7 years ago
#

Hi Proximente will be available in different (VP) https://tiburonesdealetacorta.blogspot.com/2019/11/tac-vp-initial-balance.html

Gianluca
7 years ago
#

nicolas why prt doesn't implement volume profile as standard indicator like the majority of the platforms?

namrevlis24
7 years ago
#

0 is no difference, unfortunately :-|

namrevlis24
7 years ago
#

Hi, solution to have transparent lines is to use PRT V 10.3, not V 11 beta as I did :-)

namrevlis24
7 years ago
#

Hi, is it possible to make the volume lines transparent? Your screenshot shows transparent lines (rectangles). I tried to change the 4th parameter in the "coloured" function of line >> drawrectangle(startbar,(hrange+lrange)/2,startbar+bullbar,(hrange+lrange)/2) coloured(0,100,200,20) to any values between 1 and 255 but nothing changes. How did you get it running? Thanks in Advance!


Nicolas
7 years ago
#

Try with 0

Hendrix
7 years ago
#

Buonasera, volevo sapere se era possibile avere l'indicatore solo con il volume profile di 4 giorni e su ogni giorno il POC. Grazie

Gianluca
7 years ago
#

Hello what happened? why you close your web site? it was amazing!

JOSE LUIS CAPO
7 years ago
#

Muchisimas gracias por las valiosas herramientas de volumen que compartes con los usuarios de PRT y también por aportar tu conocimiento en tu maravilloso blog. Espero impacientemente el Range Volume Profile. Un saludo.


Stenozar
7 years ago
#

Hi TAC, I can't see on the graph the Low volume and High volume areas; should they appear automatically? thanks

TAC Bolsa
7 years ago
#

hello, not included, it's just a way to interpret ... If it will be included in the new version. https://pbs.twimg.com/media/D1rqYbkW0AE1qFC.jpg:large

Gianluca
7 years ago
#

THANK YOU AGAIN. You are such amazing

karim78300
8 years ago
#

bonjours je n'arrive pas a a mettre votre code on me demande de définire la variable subasta pvp dpvp vwap je vous remercie de votre aide et de votre partage Karim Paris


TAC Bolsa
7 years ago
#

Do not copy the code, download the indicator and then place it on the price.

TAC Bolsa
8 years ago
#

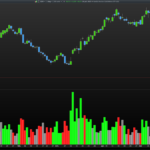
Upgrade.. From the VWAP and activated auction you can see the areas of lower or greater volume.

19Tom85
6 years ago
#

Hi TAC Bolsa, your indicators are very value adding. May I ask you to please invite to your blog as it seems I can't have access if I am not invited. Best regards

Juanjo
8 years ago
#

Estoy esperando con muchas ganas prorealtime11, ..señalar que gracias a la lectura de vuestra pagina web, y de libros sobre Wyckoff, ..Anna Coluling, etc, he mejorado muchísimo mi operativa, de hecho, ..en todos mis sistemas incorporo el volumen y vuestros indicadores. Un saludo.

Juanjo
8 years ago
#

Como siempre un trabajo brillante, Gracias por el aporte.

TAC Bolsa
8 years ago
#

Gracias Juanjo... esto no será nada cuando tengamos @Prorealtime11 esperamos dar un gran salto cuántico con la programación y desarrollo de nueva generación de indicadores de volumen.

marcov66
8 years ago
#

Great ! Thanks a lot. Marco

ProRealCode ProRealCode
Loading...