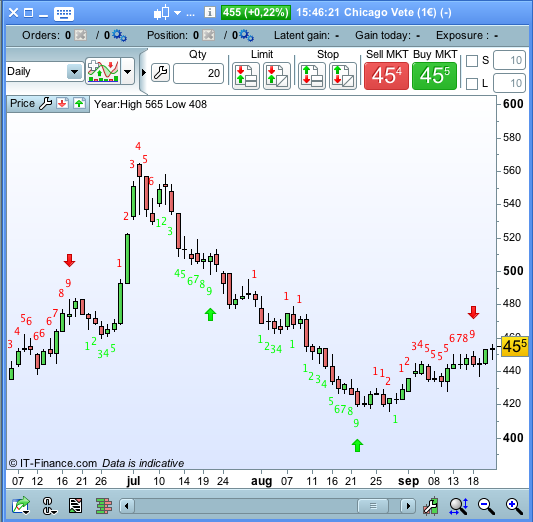
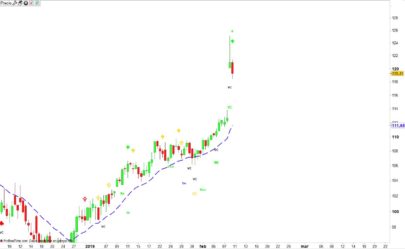
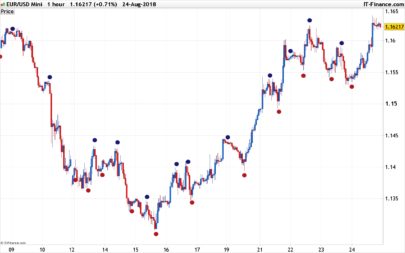
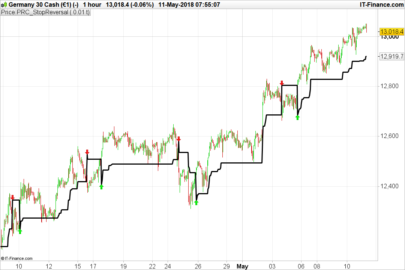
On request I programmed the Thomas Demark indicator TD Sequential -Setup. It counts up to 9 consecutive bars to complete the setup and if the setup is completed with a “perfection buy /sell signal” it draws an arrow over/below the signal candle.
The TD Setup requires 9 consecutive bars matching criteria plus a final criterium to generate a buy/sell signal. After A TD Setup is completed the TD countdown starts which requires 13 occurrences of a pattern that don’t have to be consecutive. On completion this generates additional buy/sell signals (blue arrows).
The TD Sequential Indicator was developed by Tom DeMark for trading on the FOREX market. It is also suitable for the market of commodities and options.
This indicator looks for the opposite trend in order to anticipate and identify the turning points of the market. It provides signals in intraday and also on daily timeframe.
Discussions about this indicator can be found in this forum topic: https://www.prorealcode.com/topic/td-sequential-setup/
|
1 2 3 4 5 6 7 8 9 10 11 12 13 14 15 16 17 18 19 20 21 22 23 24 25 26 27 28 29 30 31 32 33 34 35 36 37 38 39 40 41 42 43 44 45 46 47 48 49 50 51 52 53 54 55 56 57 58 59 60 61 62 63 64 65 66 67 68 69 70 71 72 73 74 |
once TDSL=0 once TDSS=0 once BuySetup=0 once SellSetup=0 Once BuyCountdown=0 once SellCountdown=0 if close[1]>close[5] and close<close[4] then bearishflip=1 bullishflip=0 elsif close[1]<close[5] and close>close[4] then bullishflip=1 bearishflip=0 endif if close<close[4] and bearishflip then TDSL=TDSL+1 TDSS=0 elsif close>close[4] and bullishflip then TDSS=TDSS+1 TDSL=0 endif if TDSL>0 and TDSL<10 then drawtext("#TDSL#",barindex,low-10*pipsize) coloured(0,255,0) endif if TDSL=9 then L=(low<low[3] and low<low[2]) or (low[1]<low[2] and low[1]<low[3]) bearishflip=0 TDSL=0 BuySetup=1 if L then DRAWARROWUP(barindex,low-20*pipsize) coloured(0,255,0) endif endif if TDSS>0 and TDSS<10 then drawtext("#TDSS#",barindex,high+10*pipsize) coloured(255,0,0) endif if TDSS=9 then S=(high>high[2] and high>high[3]) or (high[1]>high[3] and high[1]>high[2]) bullishflip=0 TDSS=0 SellSetup=1 if S then DRAWARROWDOWN(barindex,high+20*pipsize) coloured(255,0,0) endif endif if BuySetup then if close<=low[2] then BuyCountdown=BuyCountdown+1 drawtext("#BuyCountdown#",barindex,low-10*pipsize) coloured(0,0,255) endif if BuyCountdown=8 then Bar8=barindex elsif BuyCountdown=13 then // TD Countdown perfection buy if low<=close[barindex-Bar8] then DRAWARROWUP(barindex,low-20*pipsize) coloured(0,0,255) endif BuySetup=0 BuyCountdown=0 endif elsif SellSetup then if close>=high[2] then SellCountdown=SellCountdown+1 drawtext("#SellCountdown#",barindex,high+10*pipsize) coloured(0,0,255) endif if SellCountdown=8 then Bar8=barindex elsif SellCountdown=13 then //TD Countdown perfection sell if high>=close[barindex-Bar8] then DRAWARROWDOWN(barindex,high+20*pipsize) coloured(0,0,255) endif SellSetup=0 SellCountdown=0 endif endif return |
Share this
No information on this site is investment advice or a solicitation to buy or sell any financial instrument. Past performance is not indicative of future results. Trading may expose you to risk of loss greater than your deposits and is only suitable for experienced investors who have sufficient financial means to bear such risk.
ProRealTime ITF files and other attachments :PRC is also on YouTube, subscribe to our channel for exclusive content and tutorials





your code
your code is quite different from the original (Demark on Trade Station)
https://pasteboard.co/GMCNZmv.png
In which way? I can not see anything on your picture.
I used the rules that I found for the setup and did not translate any code from tradestation so there should be differences
Daily Chart of EUR/USD. On the right the original indicator (paid indicator) that runs on Trade Station, on the left the same chart with your code with Prorealtime. As you can see there are many differences, and mostly the original one provides exact count
Direct link:
https://s1.postimg.org/17ru2bt5un/TD_CHART_COMPARISION.png
[url=https://postimg.org/image/80cvosjd97/][img]https://s1.postimg.org/17ru2bt5un/TD_CHART_COMPARISION.png[/img][/url]
https://postimg.org/image/80cvosjd97/
The pictures are so small I can hardly read the figures even if zooming in. I think I can not debug it on the basis of this. Sorry.
Can you maybe zoom in and post a picture of the comparison again?
If you post a picture of the Tradestation version zoomed in so I can see the numbers on each candle and I also must see the date or time period the chart is showing, will try to make them matching.
…also it would be helpful to know which color in the TS version stands for what. Thanks.
I thought a little bit about this and came to the conclusion that there will be differences when you use this indicator on a daily chart (like i see you did). This is cause by IG markets infamous sunday candle. The problem is when I adapt it to daily timeframe to take care of the sunday candle it will give wrong results on any other timeframe instead. :-S
No, in the daily chart I posted there is not the sunday trading
This is the link of the chart comparision. You can download it.
https://postimg.org/image/84fwv9i6u3/
This is again the same picture. You have to zoom in so I can make use of it. Then I’m not sure if you understood me. The error is caused by IG markets sunday candle. And if I correct it for daily timeframe it will no longer work on intraday timeframes. 🙁
Which is the right code? the itf file or the code above? I obtain two different results
Wich results do you have mk_ok ?
You should use the itf file.
hii , i wonder if it is possible to create a screener based on demark indicator
for exemple if the trend is down 100ema and 200ema are down and an arrow signal to sell has just pinted
Hi Despair, dont know why after import and add your indicator, it does not go on to the price chart, could you help out? thanks
Apply it on the price chart with the wrench at the left upper side of the price chart.
Hi Despair
Thanks for writing the code and for generously making it available to the public. I have been using Trading View and there is quite a good TD Sequential available on that platform but in some ways your version is superior, since it includes the “+” for the unperfected TD Sequential Countdown. The TV version that I am using does however have a handy feature in that it identifies the resistance and support lines, which are taken from the Lows of the TD Sell Setup and the Highs of the TD Buy Setup. If I knew how to code I would try to include these but alas I am unable, and so I’m wondering if you are someone else would consider adding this handy feature?
Cheers Sydneyhom