General Description
This indicator is designed for scalping trading, providing entry signals for long and short positions based on technical analysis of moving averages and volume oscillators. Additionally, it includes advanced options for managing stop loss and take profit based on the average movement and the ATR (Average True Range).
How the Indicator Works
The indicator uses a combination of moving averages and Hoffman retracements to identify optimal entry points. These are the key components:
– Moving Averages (MAs): Several moving averages (SMA and EMA) are used to determine the general market trend. The alignment of these averages suggests the strength of the trend and potential entry points.
– Hoffman Retracements: Calculated based on the user-configured retracement percentage. This helps identify retractions in the trend that may be entry opportunities.
– Volume Oscillator: Optionally, the indicator can use a volume oscillator to filter entry signals, requiring that volume confirms the direction of the trend.
– ATR (Average True Range): Can be configured to adjust stop losses according to the average true range, allowing for more dynamic risk management.
How to Interpret the Indicator
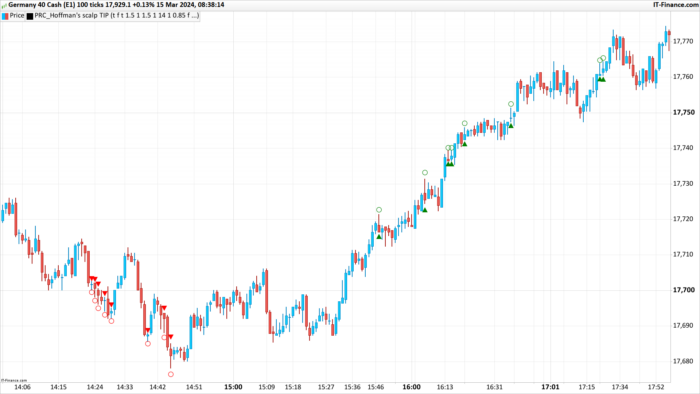
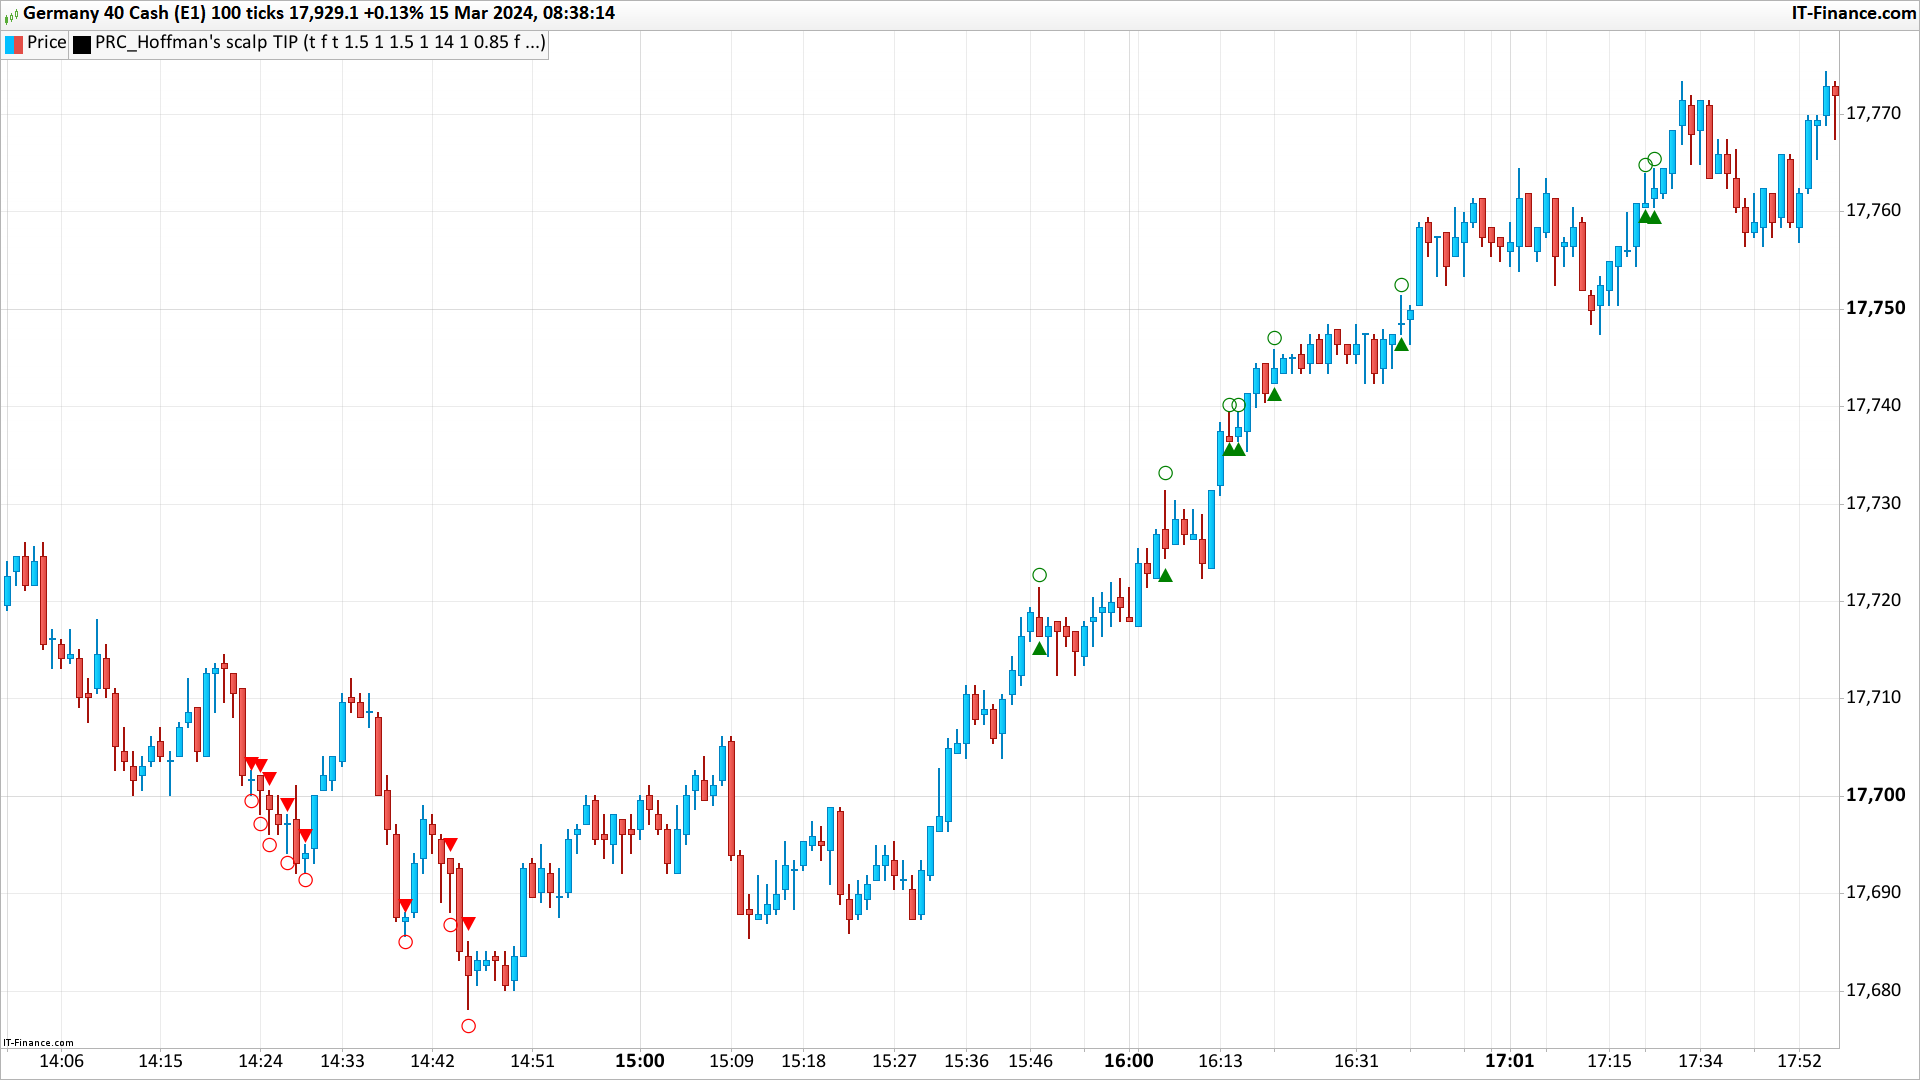
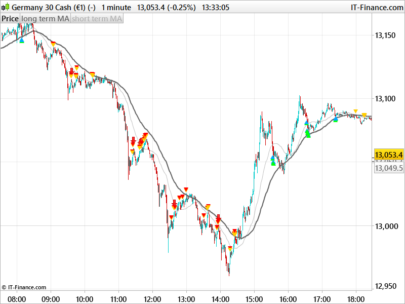
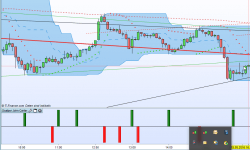
– Long Entry Signals (Buy): Generated when bullish trend conditions and specific criteria of the indicator are met, marked by a upward triangle below the bar.
– Short Entry Signals (Sell): Generated under bearish trend conditions according to the indicator’s criteria, indicated by an downward triangle above the bar.
– Take Profit and Stop Loss: Dotted lines are displayed to indicate the suggested levels of take profit and stop loss, based on the entry configuration and the user-specified risk/reward ratio.
Available Settings
– MA Display: Allows to activate or deactivate the display of moving average lines.
– Stop Loss and Take Profit Configuration: Can be adjusted so that the stop loss is based on the ATR or the moving average, with a predetermined risk/reward ratio of 1.5. The user can modify this ratio, as well as specify percentages for the take profit and stop loss if the ATR or MA is not used for the SL.
– Open Position Threshold and Hoffman Retracements: The user can adjust the threshold to open positions and the Hoffman retracement percentage to fine-tune the entry signals.
– Volume Oscillator and ATR: Options to activate the use of the volume oscillator and display the ATR on the chart, including color customization and lengths.
Usage Examples and Strategies
1. Trend Trading: Identify the general trend direction using the MAs. Look for entry signals that match this direction for safer positions.
2. Scalping on Retracements: Use Hoffman retracements to find entry opportunities in minor corrections of a larger trend.
3. Risk Management: Adjust the risk/reward ratio and the levels of stop loss and take profit according to your risk tolerance and trading objectives.
Conclusion
Hoffman’s Scalp Indicator is a powerful tool for traders looking to take advantage of short-term market opportunities, providing a solid framework for entry and exit operations based on advanced technical analysis. The available customization allows traders to adapt the indicator to their strategies and specific risk/reward needs, making it a versatile addition to any trading arsenal.
|
1 2 3 4 5 6 7 8 9 10 11 12 13 14 15 16 17 18 19 20 21 22 23 24 25 26 27 28 29 30 31 32 33 34 35 36 37 38 39 40 41 42 43 44 45 46 47 48 49 50 51 52 53 54 55 56 57 58 59 60 61 62 63 64 65 66 67 68 69 70 71 72 73 74 75 76 77 78 79 80 81 82 83 84 85 86 87 88 89 90 91 92 93 94 95 96 97 98 99 100 101 102 103 104 105 106 107 108 109 110 111 112 113 114 115 116 117 118 119 120 121 122 123 124 125 126 127 128 129 130 131 132 133 134 135 136 137 138 139 140 141 142 143 144 145 146 147 148 149 150 151 152 153 154 155 156 157 158 159 160 161 162 163 164 165 166 167 168 169 170 171 172 173 174 175 176 177 |
//PRC_Hoffman's scalp TIP //version = 0 //14.03.24 //Iván González @ www.prorealcode.com //Sharing ProRealTime knowledge ////////////////////////////////////////////////////////////////////// //---------------------------Inputs------------------------------- autoprofit = 1 //Stop loss according to Moving Average (with risk reward ratio) riskreward = 1.5 //Risk reward ratio OpenPositionTreshold = 1 //Open position threshold % useATR = 0 // Use ATR for stop loss (with risk reward ratio) atrlength = 14//Length atrsmoothing = 1 //RMA=1 - SMA=2 - EMA=3 - WMA=4 atrm = 0.85 // Multiplier myTakeProfit = 1.5 //TakeProfit % (if not in use ATR or MA for SL) myStopLos = 1 // StopLoss % (if not in use ATR or MA for SL) ShowTPSLLines = 1//Show take profit & stop loss lines usevol = 0 //Use volume oscillator for signals z = 45 // Inventory Retracement Percentage % //-------------------------------------------------------------- //------------------Moving Averages------------------------------- sma5 = average[5](close) ema18 = average[18,1](close) ema20 = average[20,1](close) ema35 = average[35,1](close) sma50 = average[50](close) sma89 = average[89](close) ema144 = average[144,1](close) //-------------------------------------------------------------- //---------------Hoffmans bar retracements----------------------- // Candle Range a = abs(high - low) // Candle Body b = abs(close - open) // Percent to Decimal c = z/100 // Range Verification rv = b < c*a // Price Level for Retracement x = low + (c * a) y = high - (c * a) sl = rv=1 and high > y and close < y and open < y ss = rv=1 and low < x and close > x and open > x // Line Definition if sl then li=y elsif ss then li=x else li=(x+y)/2 endif //-------------------------------------------------------------- //-----------Volume Oscillator---------------------------------- once cumvol = 0 cumvol = volume+cumvol shortlen = 5 //Short Length longlen = 10 //Long Length short = average[shortlen,1](volume) long = average[longlen,1](volume) osc = 100*(short-long)/long //-------------------------------------------------------------- //---------------------ATR-------------------------------------- atrsrc1 = high atrsrc2 = low atrsrc = tr if atrsmoothing = 1 then alpha = 1/atrlength if barindex = atrlength then atrafun = average[atrlength](atrsrc) else atrafun = alpha*atrsrc + (1-alpha)*atrafun[1] endif elsif atrsmoothing = 2 then atrafun = average[atrlength](atrsrc) elsif atrsmoothing = 3 then atrafun = exponentialaverage[atrlength](atrsrc) elsif atrsmoothing = 4 then atrafun = weightedaverage[atrlength](atrsrc) endif atra = atrafun*atrm atrx = atrsrc1+atrafun*atrm atrx2 = atrsrc2-atrafun*atrm //-------------------------------------------------------------- //-------------Plot Statement----------------------------------- LongHoff = sl and sma5>ema18 and ema18>ema20 and ema20>ema144 and low>sma5 ShortHoff = ss and sma5<ema18 and ema18<ema20 and ema20<ema144 and high<sma5 if LongHoff then drawtext("▲",barindex,low-tr*0.25)coloured("green")//Long bar elsif ShortHoff then drawtext("▼",barindex,high+tr*0.25)coloured("red")//short bar endif if useVOL then longcondition = LongHoff and close > sma50 and osc > 0 shortcondition = ShortHoff and close < sma50 and osc > 0 else longcondition = LongHoff and close > sma50 shortcondition = ShortHoff and close < sma50 endif //-----------Plot SL & TP lines long condition----------------------- StopLosY = sma5 TakeProfitY = high + (OpenPositionTreshold * ((high-low)/100)) + (riskreward * ((high+ (OpenPositionTreshold * ((high-low)/100)))-sma5)) if useatr then StopLosY = atrx2 TakeProfitY = high + (OpenPositionTreshold * ((high-low)/100)) + (riskreward * ((high+ (OpenPositionTreshold * ((high-low)/100)))-atrx2)) else if Autoprofit then StopLosY = sma5 TakeProfitY = high + (OpenPositionTreshold * ((high-low)/100)) + (riskreward * ((high+ (OpenPositionTreshold * ((high-low)/100)))-sma5)) else StopLosY = (high + (OpenPositionTreshold * ((high-low)/100))) - ((myStopLos/(((high + (OpenPositionTreshold * ((high-low)/100)))-low)/(low/100)))*((high + (OpenPositionTreshold * ((high-low)/100)))-low)) TakeProfitY = high + (OpenPositionTreshold * ((high-low)/100)) +((myTakeProfit/((high-low)/(low/100)))*(high-low)) endif endif if longcondition then drawtext("○",barindex,high+tr*0.25)coloured("green")//long signal $longx[lastset($longx)+1] = barindex $stopLosY[lastset($stopLosY)+1] = StopLosY $TakeProfitY[lastset($TakeProfitY)+1] = TakeProfitY $enterlong[lastset($enterlong)+1] = high + (OpenPositionTreshold * ((high-low)/100)) endif //-----------Plot SL & TP lines Short condition----------------------- sStopLosY = sma5 sTakeProfitY = (low - (OpenPositionTreshold * ((high-low)/100))) - (riskreward * (sma5 - (low - (OpenPositionTreshold * ((high-low)/100))))) if useATR then sStopLosY = atrx sTakeProfitY = (low - (OpenPositionTreshold * ((high-low)/100))) - (riskreward * (atrx - (low - (OpenPositionTreshold * ((high-low)/100))))) else if autoprofit then sStopLosY = sma5 sTakeProfitY = (low - (OpenPositionTreshold * ((high-low)/100))) - (riskreward * (sma5 - (low - (OpenPositionTreshold * ((high-low)/100))))) else sStopLosY =( low - (OpenPositionTreshold * ((high-low)/100))) + ((myStopLos/((high-(low - (OpenPositionTreshold * ((high-low)/100))))/((low - (OpenPositionTreshold * ((high-low)/100)))/100)))*(high-(low - (OpenPositionTreshold * ((high-low)/100))))) sTakeProfitY =(low - (OpenPositionTreshold * ((high-low)/100))) - ((myTakeProfit/((high-(low - (OpenPositionTreshold * ((high-low)/100))))/((low - (OpenPositionTreshold * ((high-low)/100)))/100)))*(high-(low - (OpenPositionTreshold * ((high-low)/100))))) endif endif if shortcondition then drawtext("○",barindex,low-tr*0.25)coloured("red")//short signal $shortx[lastset($shortx)+1] = barindex $sstopLosY[lastset($sstopLosY)+1] = sStopLosY $sTakeProfitY[lastset($sTakeProfitY)+1] = sTakeProfitY $entershort[lastset($entershort)+1] = (low - (OpenPositionTreshold * ((high-low)/100))) endif //-----------Plot Last Trade ----------------------- if islastbarupdate and ShowTPSLLines then ///Last Long trade drawsegment($longx[max(0,lastset($longx))]+1,$enterlong[max(0,lastset($enterlong))],$longx[max(0,lastset($longx))]+30,$enterlong[max(0,lastset($enterlong))])coloured("gray")style(dottedline,2) drawsegment($longx[max(0,lastset($longx))]+1,$TakeProfitY[max(0,lastset($TakeProfitY))],$longx[max(0,lastset($longx))]+50,$TakeProfitY[max(0,lastset($TakeProfitY))])coloured("teal")style(dottedline,2) drawsegment($longx[max(0,lastset($longx))]+1,$stopLosY[max(0,lastset($stopLosY))],$longx[max(0,lastset($longx))]+50,$stopLosY[max(0,lastset($stopLosY))])coloured("maroon")style(dottedline,2) drawtext("Open Long",$longx[max(0,lastset($longx))]+40,$enterlong[max(0,lastset($enterlong))]+0.35*tr[1])coloured("Blue") drawtext("TP",$longx[max(0,lastset($longx))]+40,$TakeProfitY[max(0,lastset($TakeProfitY))]+0.35*tr[1])coloured("Green") drawtext("SL",$longx[max(0,lastset($longx))]+40,$stopLosY[max(0,lastset($stopLosY))]+0.35*tr[1])coloured("Red") ///Last Short Trade drawsegment($shortx[max(0,lastset($shortx))]+1,$entershort[max(0,lastset($entershort))] ,$shortx[max(0,lastset($shortx))]+30,$entershort[max(0,lastset($entershort))])coloured("gray")style(dottedline,2) drawsegment($shortx[max(0,lastset($shortx))]+1,$sstopLosY[max(0,lastset($sstopLosY))],$shortx[max(0,lastset($shortx))]+50,$sstopLosY[max(0,lastset($sstopLosY))])coloured("maroon")style(dottedline,2) drawsegment($shortx[max(0,lastset($shortx))]+1,$sTakeProfitY[max(0,lastset($sTakeProfitY))],$shortx[max(0,lastset($shortx))]+50,$sTakeProfitY[max(0,lastset($sTakeProfitY))])coloured("teal")style(dottedline,2) drawtext("Open Short",$shortx[max(0,lastset($shortx))]+40,$entershort[max(0,lastset($entershort))]+tr[1]*0.35)coloured("Blue") drawtext("TP",$shortx[max(0,lastset($shortx))]+40,$sTakeProfitY[max(0,lastset($sTakeProfitY))]+tr[1]*0.35)coloured("green") drawtext("SL",$shortx[max(0,lastset($shortx))]+40,$sstopLosY[max(0,lastset($sstopLosY))]+tr[1]*0.35)coloured("red") endif //-------------------------------------------------------------- return //sma50 As "SMA50"coloured("white")style(line,2),sma5 as "SMA5"coloured("purple")style(line,2),ema18 as "EMA18"coloured("green")style(line,2),ema20 as "EMA20"coloured("silver")style(line,1),sma89 as "SMA89"coloured("silver")style(line,1),ema144 as "EMA144"coloured("silver")style(line,1),ema35 as "EMA35"coloured("silver")style(line,1) |
Share this
No information on this site is investment advice or a solicitation to buy or sell any financial instrument. Past performance is not indicative of future results. Trading may expose you to risk of loss greater than your deposits and is only suitable for experienced investors who have sufficient financial means to bear such risk.
ProRealTime ITF files and other attachments :PRC is also on YouTube, subscribe to our channel for exclusive content and tutorials



tks btw have you seen that ATH levels indicator.. just a simple set of highs and lows… can you convert please TIA