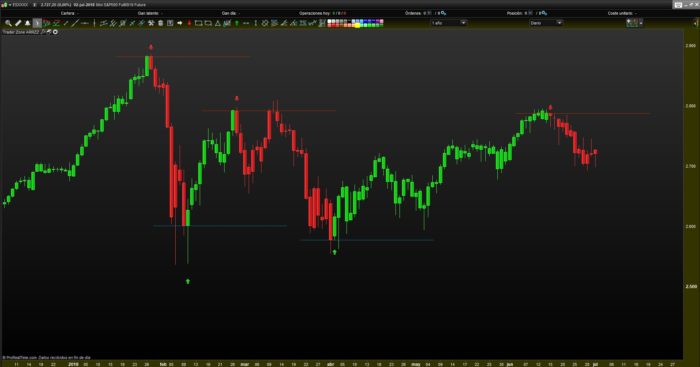
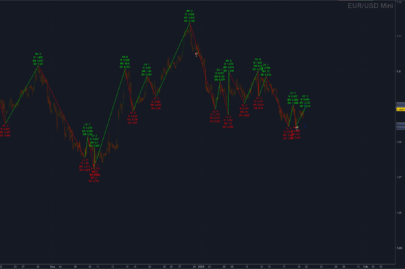
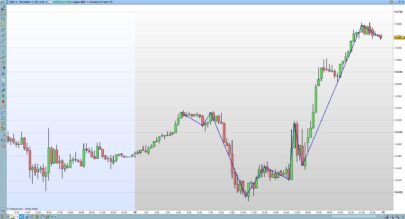
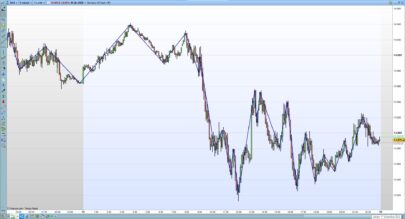
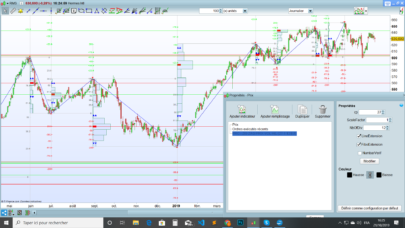
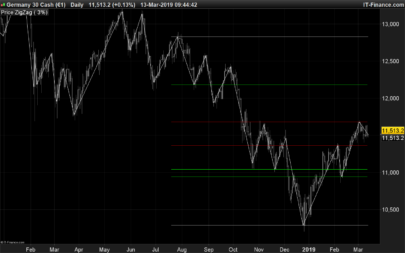
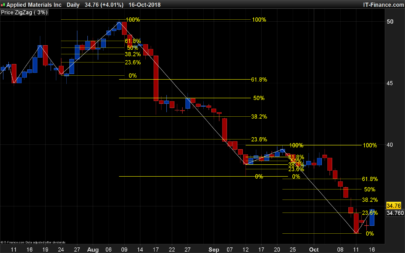
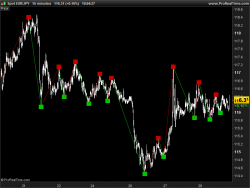
Fractals made of ZigZag that marks support and resistance.
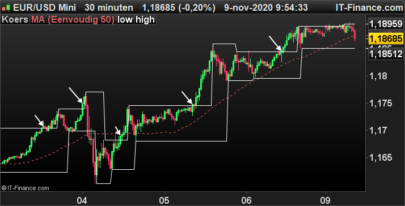
In Higher timeframe, we can obtained the trend.
Candlesticks are painted with the color of the trend, found by the last support or resistance.
|
1 2 3 4 5 6 7 8 9 10 11 12 13 14 15 16 17 18 19 20 21 22 23 24 25 26 27 28 29 30 31 32 33 34 35 36 37 38 39 |
/////////////////////////////////////////////////////////////////////// REM Trader Zone ARRZZ REM Trader Zone ARRZZ | indicator REM 03.07.2018 REM RB @ www.tiburonesdealetacorta.com REM Sharing www.tiburonesdealetacorta.com //////////////////////////////////////////////////////////////////////// ATR = averagetruerange[3](close) Data = customclose mov = ZigZag[6](close) cuerpo = ( close - open ) Alcista = mov>mov[1] and mov[1]<mov[2] Bajista = mov<mov[1] and mov[1]>mov[2] If cuerpo > 0 then if alcista then DRAWARROWUP(barindex,low-atr/4) coloured(0,200,0) drawtext(" --------------------------------------------------------------------------------------------------------------------------",barindex[0],data[1]) coloured(0,146,193) r=0 g=200 b=0 endif endif If cuerpo < 0 then if bajista then DRAWARROWDOWN(barindex[0],high+atr/4) coloured(200,0,0) drawtext(" ---------------------------------------------------------------------------------------------------------------------------",barindex[0],data[1]) coloured(204,51,0) r=200 g=0 b=0 endif endif drawcandle(open,high,low,close) coloured(r,g,b) return |
Share this
No information on this site is investment advice or a solicitation to buy or sell any financial instrument. Past performance is not indicative of future results. Trading may expose you to risk of loss greater than your deposits and is only suitable for experienced investors who have sufficient financial means to bear such risk.
ProRealTime ITF files and other attachments :PRC is also on YouTube, subscribe to our channel for exclusive content and tutorials



muy bueno. Lo malo que repinta. Saludos
Si no repintara llenaría el gráfico de lineas… úsalo en gráficos DIARIO para seguir la tendencia.
lo estoy provando en diario.
Yo siempre recomiendo los indicadores en base de su documentación.
https://www.tiburonesdealetacorta.com/2018/07/indicador-trader-zone-arrzz.html
Una de las cosas que recomiento es no usar el indicador si no esta consolidada la zona .
NOTA:”Recuerda que el indicador marca la zona de trading, si una de estas zonas pierde el soporte o la resistencia, tendrás que esperar que marque nueva zona para trabajarla.”
Al tratarse de indicador que marca soportes si pierde la zona perderá el soporte y viceversa.
En la documentación he puesto una imagen del BBVA
https://4.bp.blogspot.com/-gTgpnj0zFqU/WztJZB7Vk2I/AAAAAAAAB4Q/-SYxCIKKh-IZiQzaPh59AQdugmoFHuyowCLcBGAs/s1600/bbva.jpg
Como marca la zona de Trading..
Recuerda que las descargas siempre están mejoradas en el Blog.
Descarga Mejorada y Directa
I don’t get any signals, just black bars. What’s the problem?
Download the improved version.
https://www.tiburonesdealetacorta.com/2018/07/indicador-trader-zone-arrzz.html
within the Blog.
https://www.tiburonesdealetacorta.com/2018/07/indicador-trader-zone-arrzz.html
search
Improved and Direct Download Here.
Spanish
Descarga Mejorada y Directa Aqui.
Click with the mouse Here ……….Aqui…
sorry.
Tageschart – dann funzt es!
Sorry, I don’t understand spanish. Could you just give me the link to the file, please? Don’t know where to download it from your site ^^
Wrong comment
Oder im separaten Fenster öffnen
Ich finde keinen Download-Link auf seiner Seite für die “improved version”. Komme kaum durch die Seite, weil ich kein spanisch kann 😉
Ich hab’s… Wort für Wort mit der Maus abgegangen und plötzlich war “Aqui” unterlegt 😀
Improved and Direct Download Here. Clic en ……..Here……
Dear TAC Bolsa,
you are (obviously?) aware of the fact that the ZIGZAG function is ongoingly “repainted”, it adjust itself depending on the last closes. (for example if the last closes increases, the ZIGZAG goes up. If before the treshold ZIGZAG percentage, like 0,5% will be reached, the close decreases to further than the initial increase, the ZIGZAG line goes down and repaint the upgoing ZIGZAG line from the previous bars to a downtrend ZIGZAG line)
Is it correct that your indicator will accordingly repainted as well ? (It looks to me it does looking at your code) If it does, should it not be noted to the users of this indicator ?
Kind regards, Jan
This indicator draws a trade area, does not indicate a signal to enter or exit the markets.
This publication is an idea of many, of how a commercial area is made.
The improved indicator can be found in the Blog, where the Zigzag is replaced by another development.
To your question, if you read the forum, I think I’ve already commented …
The supports and resistance also change when the price goes through one or the other,
Sometimes they invest and in others they disappear …
These indicators try to teach systems programming in the stock market.
Download the improved version. V2
https://www.tiburonesdealetacorta.com/2018/07/indicador-trader-zone-arrzz.html
Complimenti, un ottimo lavoro!!!
Thank yo
hallo how to dwonload it
https://www.tiburonesdealetacorta.com
After how many bars will this indicator be able to switch from signaldirection?
Here you have the information of the indicator.
https://www.tiburonesdealetacorta.com/search/label/Indicador%20Trader%20Zone%20ARRZZ
Hi Tac Bolsa, thanks for the information. But after carefully ready all the material i still could not find the answer to my question: After how many bars will this indicator be able to switch from signaldirection?
Hello, the indicator creates the support depending on the volume and is dynamic.
Not working on PRT 11.1. And the site https://www.tiburonesdealetacorta.com does not exist. So this page is useless.