For this indicator, I have assumed that the more market participants there are, the higher the volatility.
If the volatility is high, then the direction of the price is better.
During range phases, there are therefore logically fewer participants.
To highlight this point, I went to retrieve the information in trading units on 1Tick.
The indicator calculates the number of trades per minute and averages the last 95,000 units per minute.
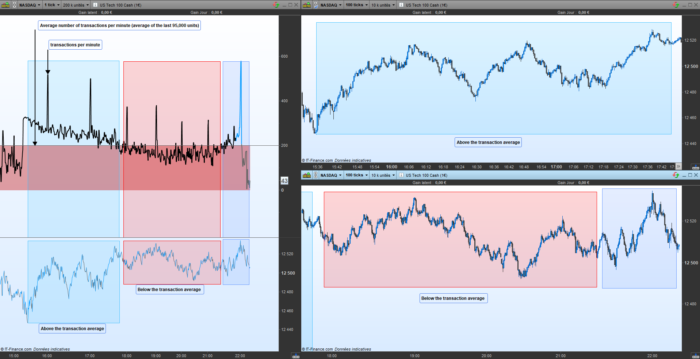
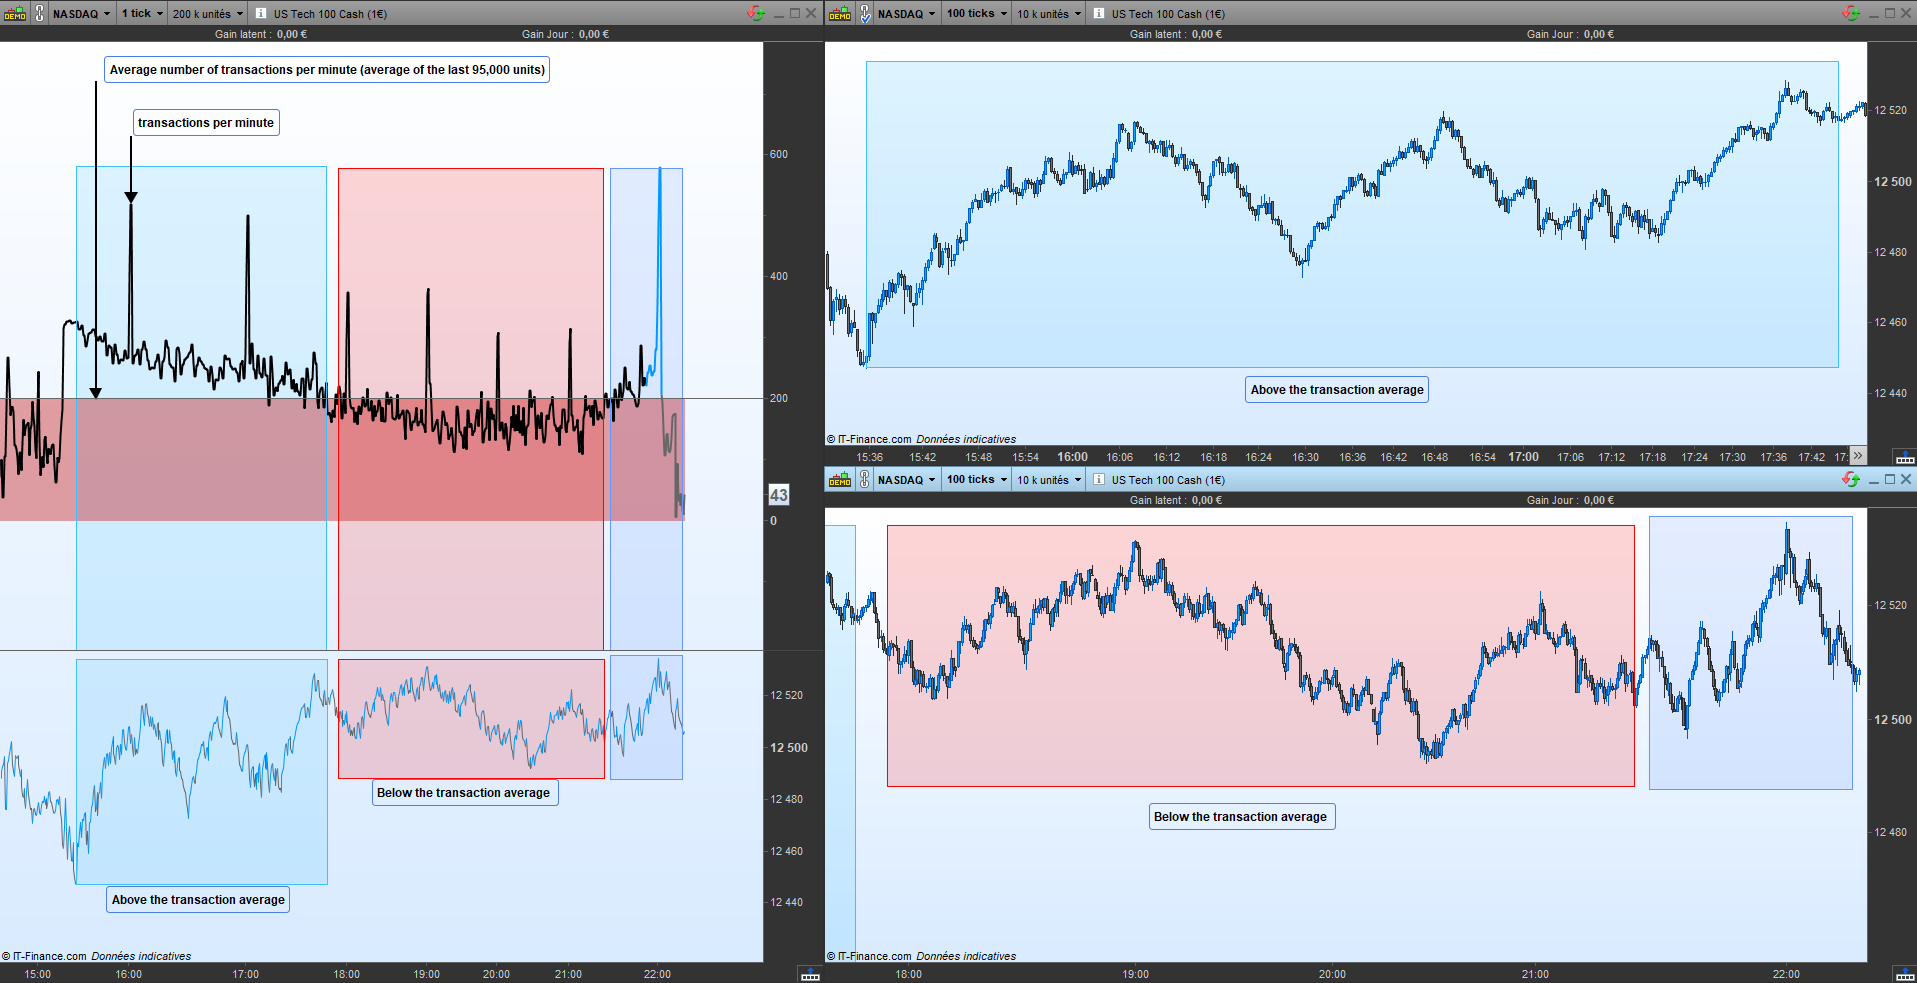
If the number of transactions is lower than the average, we will see this type of graph in the red rectangle.
If the number of transactions is above the average, then the graph will be as in the blue rectangle.
We can see that the “Blue” phase is much more directional than the “Red” phase.
This indicator works only on 1Tick with 200 K of historical data.
I also provide this link to discuss this indicator with possible updates: https://www.prorealcode.com/topic/transaction-volume-indicator/
|
1 2 3 4 5 6 7 8 9 10 11 12 13 14 15 16 17 18 19 20 21 22 23 24 25 26 27 28 29 30 31 32 33 34 35 36 37 38 39 40 41 42 43 44 45 46 47 48 49 50 51 52 53 54 55 56 57 58 59 60 61 62 63 64 65 66 67 68 69 70 71 72 73 74 75 76 77 78 79 80 81 82 83 84 85 86 87 88 89 90 91 |
// //=/===============/=//=/===============/=//=/ Nervosité // defparam drawonlastbaronly = true // //=/===============/=//=/===============/=//=/ Minute signal // //=/ signal chaque minutes signal = 0 //=// if openminute > openminute[1] then signal = 1 endif //=// if signal[1] = 1 then signal = 0 endif // //=/===============/=//=/===============/=//=/ Decompte de l'espace minute // //=/ Decompte ho = 1 if signal = 0 then ho = ho[1] + 1 endif //=// if ho < ho[1]-1 then ha = ho[ho] endif //=// if ha < ho then ha = ho endif // //=/===============/=//=/===============/=//=/ Moyenne des pics de transaction // //=/ Moyenne des transaction MxT = average[95000](ha) drawhline(MxT) coloured (R,G,B) // //=/===============/=//=/===============/=//=/ Coloration // if ha => Mxt then R = 0 G = 153 B = 255 //=// elsif ha < MxT then R = 102 G = 102 B = 102 endif // //=/===============/=//=/===============/=//=/ Visuel // //=/ Rectangle if ha => MxT then drawrectangle(barindex[95000],MxT,barindex,0) coloured(0,153,255,100) bordercolor(0,0,0,0) //=// elsif ha < MxT then drawrectangle(barindex[95000],MxT,barindex,0) coloured(199,19,19,100) bordercolor(0,0,0,0) endif // //=/===============/=//=/===============/=//=/ end // return ha coloured (R,G,B) as "Transaction" |
Share this
No information on this site is investment advice or a solicitation to buy or sell any financial instrument. Past performance is not indicative of future results. Trading may expose you to risk of loss greater than your deposits and is only suitable for experienced investors who have sufficient financial means to bear such risk.
ProRealTime ITF files and other attachments :PRC is also on YouTube, subscribe to our channel for exclusive content and tutorials







Getting syntax error.
For ProRealTime version 10.3, please delete on lines 79 and 82 the instruction “” bordercolor(0,0,0,0) “”.
I did what you said…… However, it still does not work…
I don’t know in this case, I just downloaded it again and no problem for me.
Try to download the last version, the code has been changed, maybe it will work
What’s the error that appears ?
Yes, it worked with 1Tick with 200 K . Thank you very much.