

TreL - Linear Regression Trend
April 18, 2021, 11:13 AM
Indicators
4 Comments
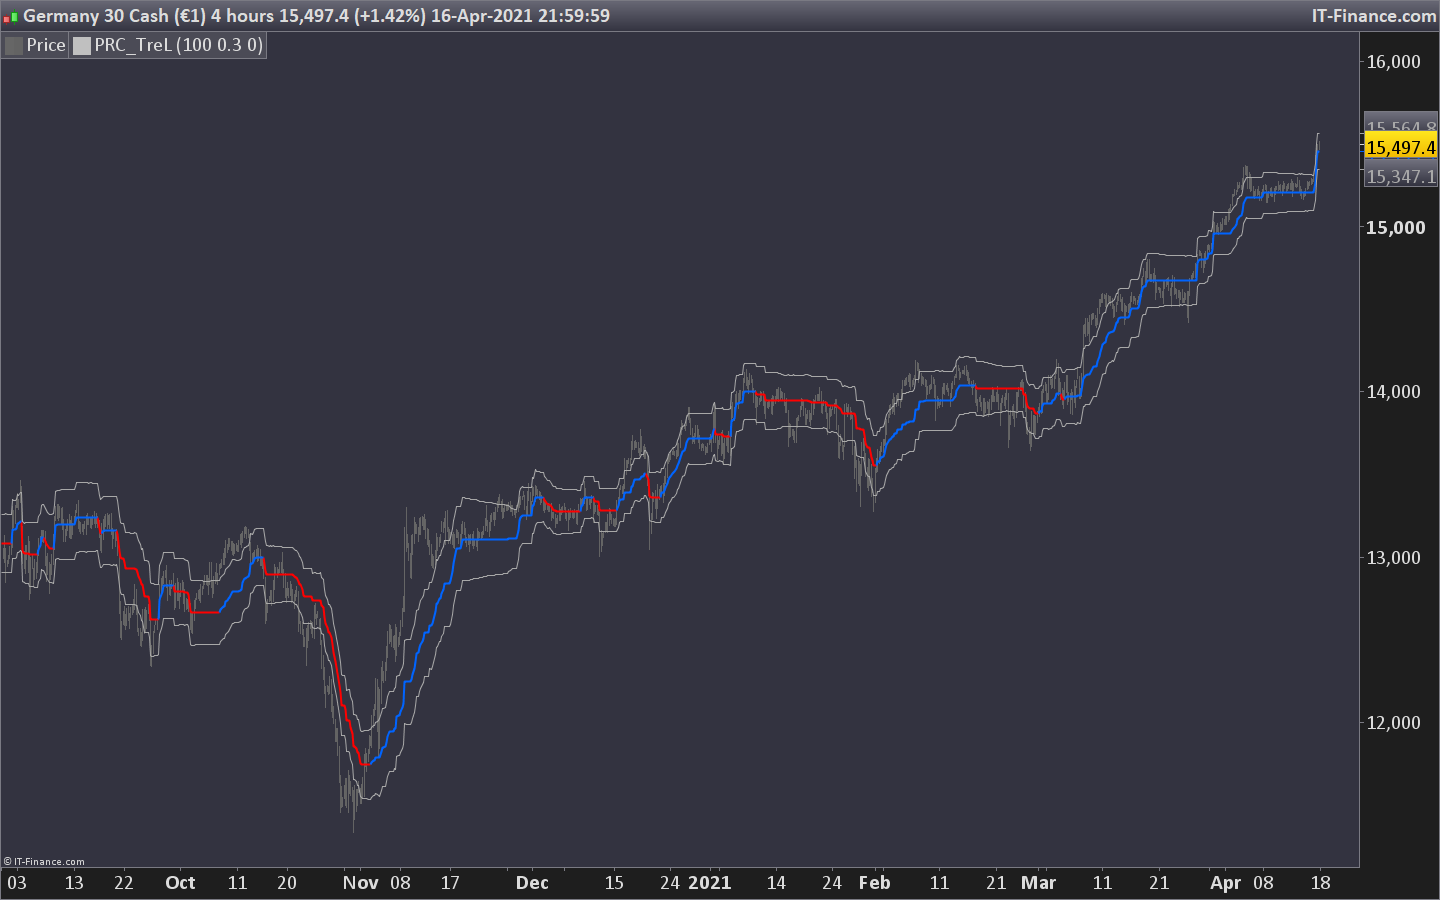
This indicator based on linear regression trend.
Blue line is a positive trend or buy/bullish trend. Red line trend is a negative trend or sell/bearish trend.
Upper and lower channel lines (in grey color) can be used as trailing stop or possible rebound of the price (revert to the mean).
Very simple and effective way to use linear regression in a different approach.
Converted from pinescript version as requested in this topic: https://www.prorealcode.com/topic/conversion-of-a-linear-regression-trend-indicator/
(all credits go to original author).
//PRC_TreL | indicator
//18.04.2021
//Nicolas @ www.prorealcode.com
//Sharing ProRealTime knowledge
//converted from pinescript

// --- settings
len = 100
off= 0
dev= 2 //Deviation (minval=0.01)
// --- end of settings

once length=100
if barindex>len then
 c = close
 cp = c
 lreg = linearregression[len](close)[off]
 lregx = linearregression[len](close)[off+1]
 b = barindex
 s = lreg - lregx
 intr = lreg - b*s
 dS = 0.0
 for i=0 to len-1 do
  dS= dS + square(cp[i]-(s*(b-i)+intr))
  de = sqrt(dS/(len))
  up = (-de*dev) + c
  dn= (de*dev) + c
 next

 c5=(high+low)/2
 //

 factor = 0.001

 hb = 0.00
 hb = (hb[1])
 hl = 0.000
 hl = (hl[1])

 lb = 0.00
 lb = (lb[1])
 l1 = 0.000
 l1 = (l1[1])

 c2 = 0
 c2 = (c2[1]) + 1

 trend = 0
 trend = (trend[1])
 n = dn
 x = up

 if barindex=0 then
  c2 = 0
  lb = n
  hb = x
  l1 = c5
  hl = c5
  //hl
  if c2 = 1 then
   if x >= hb[1] then
    hb = x
    hl = c5
    trend = 1
    //trend
    else
     lb = n
     l1 = c5
     trend = -1
     //trend
    endif
   endif
  endif

 if c > 1 then

  if trend[1] > 0 then
   hl = max(hl[1], c5)
   if x >= hb[1] then
    hb = x
    //hb
   else
    if n < hb[1] - hb[1] * factor then
     lb = n
     l1 = c5

     trend = -1
     //trend
    endif
   endif
  else
   l1 = min(l1[1], c5 )

   if n <= lb[1] then
    lb = n
    //lb
   else
    if x > lb[1] + lb[1] * factor then
     hb = x
     hl = c5

     trend = 1
     //trend
    endif
   endif
  endif
 endif

 if trend = 1 then
  v = hb
  r=0
  g=100
  b=255
 else
  v = lb
  r=255
  g=0
  b=0
 endif

 band = average[length](AverageTrueRange[1](close))*2
endif

return v coloured(r,g,b) style(line,2), v+band coloured(168,168,168), v-band coloured(168,168,168)
Download
Filename:
PRC_TreL.itf
Downloads:
638
Legend
I created ProRealCode because I believe in the power of shared knowledge. I spend my time coding new tools and helping members solve complex problems.
If you are stuck on a code or need a fresh perspective on a strategy, I am always willing to help. Welcome to the community!
Author’s Profile
Loading...