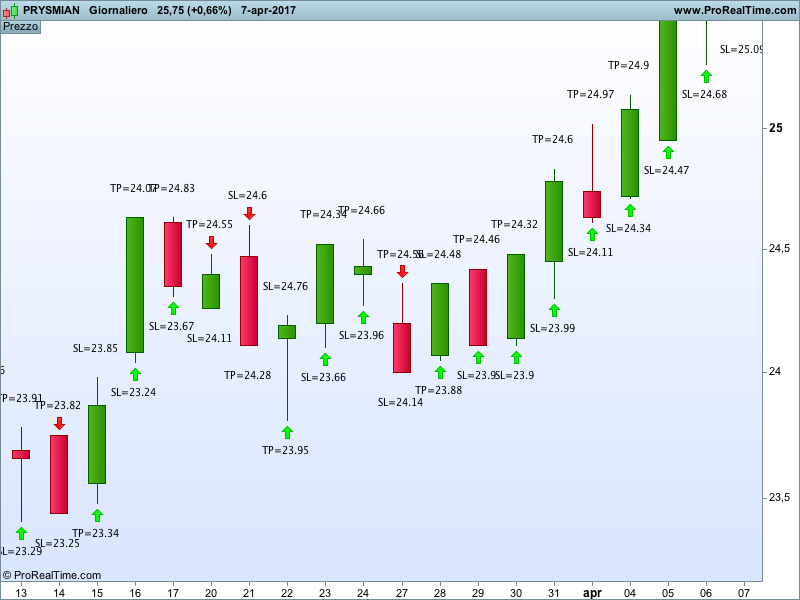
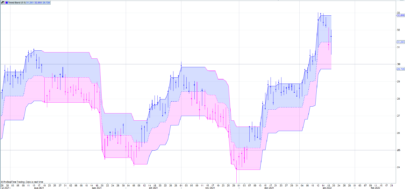
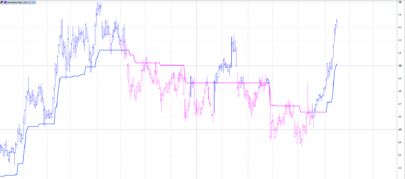
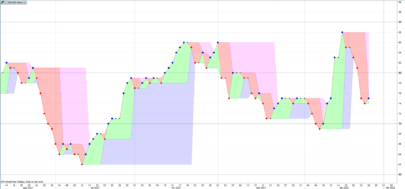
The Trend Balance Point is a system created by J. Welles Wilder and published in his book ‘New Concepts In Technical Trading Systems’. The system uses momentums to define whether to enter the market long or short and provide a Stop Loss and a Target Price for each entry. Positions are opened on THE CLOSE of the current day and closed as soon as the Target Price or the Stop Loss is hit.
According to Mr. Wilder the system works well in ranging markets and when ADX is below 20.
I personally never used this system and I haven’t done any backtesting either because PRT doesn’t allow to buy on close.
Blue skies!
|
1 2 3 4 5 6 7 8 9 10 11 12 13 14 15 16 17 18 19 20 21 22 23 24 25 26 27 28 29 30 31 32 33 34 35 36 37 38 39 40 41 42 43 44 45 46 47 48 49 50 51 52 53 54 55 56 57 58 59 60 61 62 63 64 65 66 |
periodo=2 i=1 f=i+periodo MFieri=dclose(i)-dclose(f) MFaltroieri=dclose(i+1)-dclose(f+1) massimo=MAX(MFieri,MFaltroieri) minimo=MIN(MFieri,MFaltroieri) //Calcolo TBP TBPiflong=dclose(periodo)+minimo TBPifshort=dclose(periodo)+massimo //Calcolo dello Stop loss atr1=dhigh(1)-dlow(1) atr2=dhigh(1)-dclose(2) atr3=dlow(1)-dclose(2) a=MAX(atr1,atr2) b=max(a,atr3) SLiflong=((dclose(1)+DLow(1)+dhigh(1))/3)-b SLifshort=((dclose(1)+DLow(1)+dhigh(1))/3)+b ////Calcolo del Target Price TPiflong=(2*((dclose(1)+DLow(1)+dhigh(1))/3))-dlow(1) TPifshort=(2*((dclose(1)+DLow(1)+dhigh(1))/3))-dhigh(1) TPL=round(100*TPiflong)/100 TPS=round(100*TPifshort)/100 SLL=round(100*SLiflong)/100 SLS=round(100*SLifshort)/100 once long=0 once short=0 if (close crosses over TBPifshort) then long=1 short=0 endif if (close crosses under TBPiflong) then long=0 short=1 endif if short=1 then if close crosses over TBPiflong then long=1 short=0 endif endif if long=1 then DRAWARROWUP(barindex, low*0.999) coloured (0,255,0) endif if long[1]=1 then DRAWTEXT("TP=#TPL#", barindex, high*1.005) DRAWTEXT("SL=#SLL#", barindex, low*0.995) endif if short=1 then DRAWARROWDOWN(barindex, high*1.001) coloured (255,0,0) endif if short[1]=1 then DRAWTEXT("SL=#SLS#", barindex, high*1.005) DRAWTEXT("TP=#TPS#", barindex, low*0.995) endif return |
Share this
No information on this site is investment advice or a solicitation to buy or sell any financial instrument. Past performance is not indicative of future results. Trading may expose you to risk of loss greater than your deposits and is only suitable for experienced investors who have sufficient financial means to bear such risk.
ProRealTime ITF files and other attachments :
Find other exclusive trading pro-tools on ![]()
PRC is also on YouTube, subscribe to our channel for exclusive content and tutorials


Ho provato la strategia sul Mib giornaliero su di un foglio excel nel mese di Gennaio, su 7 giornate in cui ADX < 20 fa il 100% di gain mentre dove ADX>20 ha risultati inferiori al 50% ed essendo che gli stop loss sono circa il triplo dei take profit la strategia è effettivamente in perdita, proverò a continuare il test in altri mesi anche considerando le commissioni che per ora non ho calcolato. Proverò a fare test più approfonditi ma sembra una strategia vincente a prima vista.
Alex, grazie per avere fatto il backtest. Wilder era un piccolo genio anche se con idee non toppo ortodosse alle volte. Per sua stessa definizione questo sistema ha un rapporto risk/reward negativo (voluto) e quindi devi necessariamente vincere molto piu’ spesso di quanto perdi. Inoltre da per scontato che anche tale sistema (come gli altri che lui ha creato tra cui RSI e ADX) vengano utilizzati su strumenti con elevato Commodity Selection Index (CSI). Magari nei prossimi backtest puoi tenere conto anche di questo.
Buona Pasqua
ho provato anche per febbraio e la strategia ha il 75% di risultati positivi e quelli negativi non raggiungono in ogni caso lo stop loss quindi con una perdita contenuta. Ho cercato informazioni sul CSI e sarebbe bello codificarlo su prorealtime, inoltre per poter funzionare su questa piattaforma è assolutamente necessario riuscire ad automatizzarla perché difficilmente si può aspettare ogni giorno la mezzanotte per impostare l’entrata lo stop loss e take profit per il giorno seguente. Grazie ancora per la condivisione.
Codificare il CSI e’ possibile. Io uso una sua modifica (siccome lavoro solo sull’azionario molti parametri non mi servono) e si riduce a moltiplicare ADXR per ATR. Io non uso un normale ATR ma un ATR bilanciato (allego la formula). Lo screener mi restituisce le azioni con valore di CSI maggiore e poi a quel punto e’ facile.
a=100*averagetruerange[periodo](close)/average[periodo](close)
Dopo Pasqua codifichero’ anche un altra strategia che Wilder suggerisce di usare quando il mercato e’ orizzontale che si chiama Reaction Trend System.
Wilder personalmente lo definisco un poeta del trading..
Utilizzo alcuni strumenti di Wilder, il più delle volte modificate e vestiti sulla mia operatività, ma il CSI proprio non lo mai approfondito.
Bel contributo da parte di tutti e due.. Alessandro
Vi faccio partecipi dell’evoluzione del mio studio, mi avete appassionato a Wilder che da ignorante non conoscevo. Ho provato a codificare in excel l’ADX e il Trade Balance Point come da tuo codice e i primi risultati sono ottimi direi. A breve cerco di semplificare il foglio di calcolo e se riesco a condividerlo. Non credo che si possa automatizzare la strategia perché così come concepita la maggior parte dei trade vengono chiusi in giornata e il backtest tick per tick non permette un analisi a lungo termine, oltre al problema di non poter entrare in chiusura ma solo in apertura. Sappiate però che anche entrando in apertura i risultati rimangono buoni. Quindi continuo su excel con il problema del trovare i dati corretti intraday per le varie commodities. Stay in touch 😉
Grazie mille Alex!!