

Trend Checker Graph
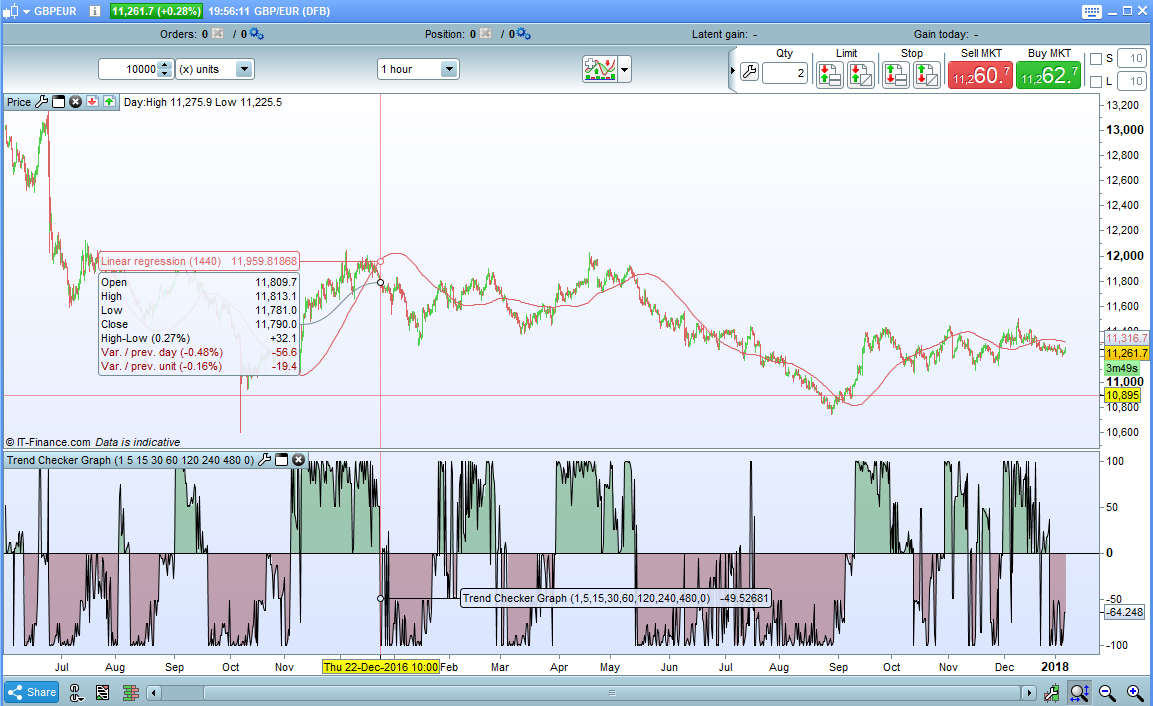
Based on my Trend Checker indicator but converting the results into a weighted graph with a range from 100 to -100. Above zero indicates that long trades are favoured and below zero that short trades are favoured.
You can set as many look back periods as you wish up to a total of eight and for whatever length look back periods you wish.
The indicator simply compares the price now to the price at the beginning of each look back period and decides if it is up or down. The longer the look back period the more weight is given to the result in the final calculation as it is difficult to argue with a long term trend.
It works on all markets and all time frames although you will have to set each period for the chosen time frame as required.
For example if you apply the indicator to a 1 hour chart you may wish to set periods of 1, 4, 24 and 144 to represent 1 hour, 4 hour, 1 day and 1 week periods. On a daily chart you might have 1, 6, 24, 96, and 312 to represent 1 day, 1 week, 1 month and 1 year. You can choose whatever periods you like in whatever order you like and you can turn any period setting off by setting it to zero.
The price used can be set to any of the following by changing the PriceType setting to:
0 – Close
1 – Open
2 – Total Price
3 – Typical Price
4 – Weighted Close
5 – Median Price
I advise downloading the itf file rather than cut and paste to ensure you get all the functions to work correctly.
//Trend Checker Graph
//Created by Vonasi

//Row1 = 1
//Row1 = 2
//Row1 = 4
//Row1 = 8
//Row1 = 12
//Row1 = 24
//Row1 = 48
//Row1 = 96
//PriceType = 0

IF PriceType >=0 and PriceType <=5 THEN
 IF PriceType = 0 THEN
  PT = close
 ENDIF

 IF PriceType = 1 THEN
  PT = open
 ENDIF

 IF PriceType = 2 THEN
  PT = TotalPrice
 ENDIF

 IF PriceType = 3 THEN
  PT = TypicalPrice
 ENDIF

 IF PriceType = 4 THEN
  PT = WeightedClose
 ENDIF

 IF PriceType = 5 THEN
  PT = MedianPrice
 ENDIF
ELSE
 PT = 0
ENDIF

Trend = 0
Factor = 100/(Row1 + Row2 + Row3 + Row4 + Row5 + Row6 + Row7 + Row8)

IF Row1 > 0 THEN
 IF PT > PT[Row1] THEN
  Trend = Trend + (Row1*Factor)
 ELSE
  IF PT < PT[Row1] THEN
   Trend = Trend - (Row1*Factor)
  ENDIF
 ENDIF
ENDIF

IF Row2 > 0 THEN
 IF PT > PT[Row2] THEN
  Trend = Trend + (Row2*Factor)
 ELSE
  IF PT < PT[Row2] THEN
   Trend = Trend - (Row2*Factor)
  ENDIF
 ENDIF
ENDIF

IF Row3 > 0 THEN
 IF PT > PT[Row3] THEN
  Trend = Trend + (Row3*Factor)
 ELSE
  IF PT < PT[Row3] THEN
   Trend = Trend - (Row3*Factor)
  ENDIF
 ENDIF
ENDIF

IF Row4 > 0 THEN
 IF PT > PT[Row4] THEN
  Trend = Trend + (Row4*Factor)
 ELSE
  IF PT < PT[Row4] THEN
   Trend = Trend - (Row4*Factor)
  ENDIF
 ENDIF
ENDIF

IF Row5 > 0 THEN
 IF PT > PT[Row5] THEN
  Trend = Trend + (Row5*Factor)
 ELSE
  IF PT < PT[Row5] THEN
   Trend = Trend - (Row5*Factor)
  ENDIF
 ENDIF
ENDIF

IF Row6 > 0 THEN
 IF PT > PT[Row6] THEN
  Trend = Trend + (Row6*Factor)
 ELSE
  IF PT < PT[Row6] THEN
   Trend = Trend - (Row6*Factor)
  ENDIF
 ENDIF
ENDIF

IF Row7 > 0 THEN
 IF PT > PT[Row7] THEN
  Trend = Trend + (Row7*Factor)
 ELSE
  IF PT < PT[Row7] THEN
   Trend = Trend - (Row7*Factor)
  ENDIF
 ENDIF
ENDIF

IF Row8 > 0 THEN
 IF PT > PT[Row8] THEN
  Trend = Trend + (Row8*Factor)
 ELSE
  IF PT < PT[Row8] THEN
   Trend = Trend - (Row8*Factor)
  ENDIF
 ENDIF
ENDIF

DrawHLine(0)

Return Trend