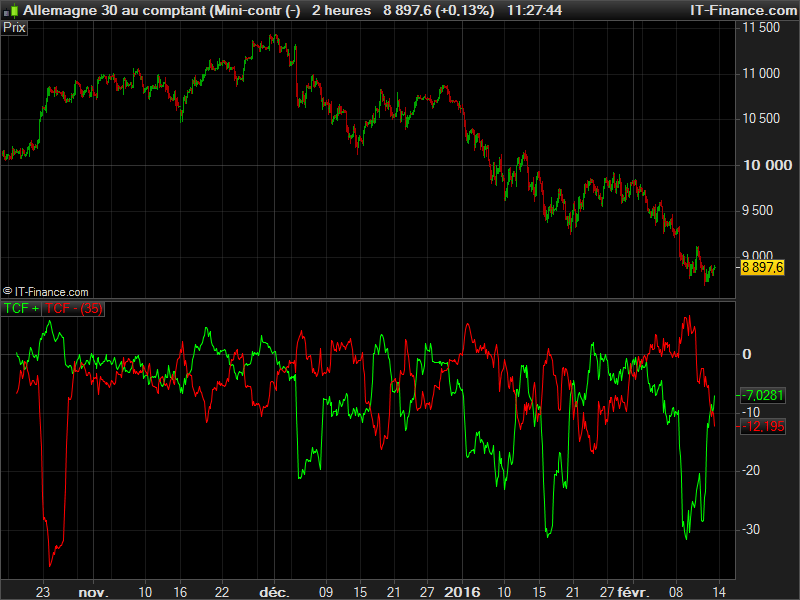
The Trend Continuation Factor is an indicator built to draw trend state. It is a typical momentum indicator calculated with the rate over change price movement, compound over a summation period.
The oscillator is made of 2 lines, the green one for summation of the ROC positive variation over the “sumperiod” and the red one for the negative price movement.
Trade would be initiated when the 2 lines cross, but it is also an effective oscillator to keep an eye on the recent trend momentum continuation.
|
1 2 3 4 5 6 7 8 9 10 11 12 13 14 15 16 17 18 19 20 21 22 23 24 25 26 27 28 29 30 31 32 33 |
//parameters // SUMperiod = 35 r = ROC[1](close) if r>0 then pc = r else pc = 0 endif if r<0 then nc = -r else nc = 0 endif if nc=0 then ncf = 0 else ncf = ncf[1]+nc endif if pc=0 then pcf = 0 else pcf = pcf[1]+pc endif TCFplus = SUMMATION[SUMperiod](pc) - SUMMATION[SUMperiod](ncf) TCFminus = SUMMATION[SUMperiod](nc) - SUMMATION[SUMperiod](pcf) RETURN TCFplus coloured(0,255,0) as "TCF +", TCFminus coloured(255,0,0) as "TCF -" |
Share this
No information on this site is investment advice or a solicitation to buy or sell any financial instrument. Past performance is not indicative of future results. Trading may expose you to risk of loss greater than your deposits and is only suitable for experienced investors who have sufficient financial means to bear such risk.
ProRealTime ITF files and other attachments :PRC is also on YouTube, subscribe to our channel for exclusive content and tutorials







Very good ! Many thanks