

Trend Direction & Force Index (TDF Index)
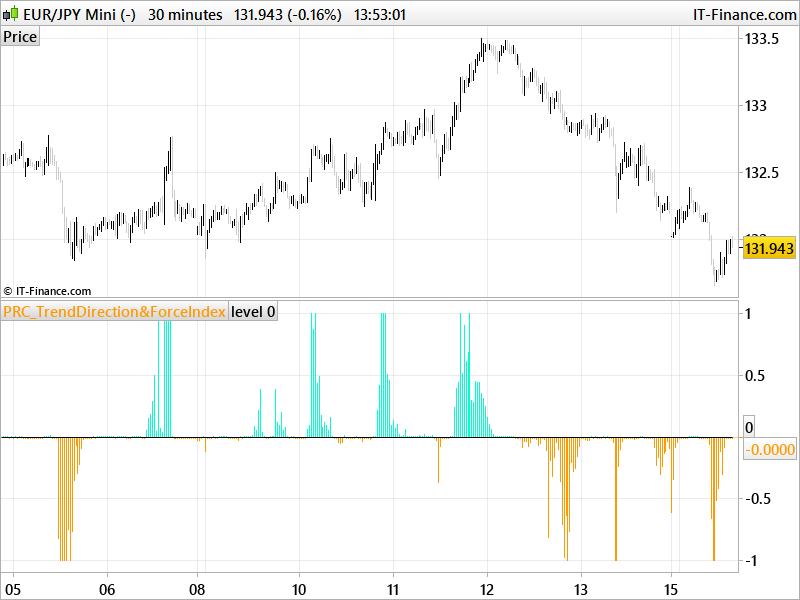
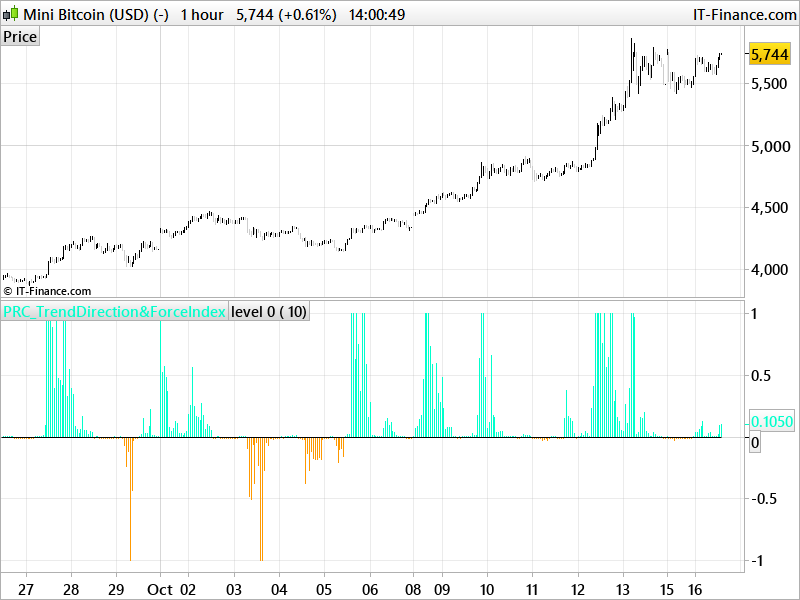
TDF can range from -1 to 1 and thus indicate the direction of the trend. The most convenient way to present graphically the two indicators as a histogram.
In periods of consolidation ratios take very low values close to zero as a rule, do not exceed the value of 0.05 (and -0.05 for TDF), which have set arbitrarily as horizontal lines signal. Rate accelerates rapidly to higher values when the period ends and the current fluctuations of horizontal movement is a good chance to become a permanent trend. I assume that as long as the pointer moves above the signal line and do not come down to the low value of less than 0.05 in at least two bars trend continues. So the descent rate below signal line for a NC post and return to higher values should be interpreted as a temporary weakening trend and further assume that it exists. Not before rate remains below 0.05 for at least 2 bars, we can consider that the market is likely to begin to move in a horizontal trend.
In addition, we can assess the strength of the trend, depending on the value of the index – the index reaches one trend is strong (-1 for TDF is a strong downward trend) and generally values above 0.6 should be so interpreted. When the rate of decline should be considered because it means that the trend is losing its momentum.
(description found on the web).
//PRC_TrendDirection&ForceIndex | indicator
//16.10.2017
//Nicolas @ www.prorealcode.com
//Sharing ProRealTime knowledge
//converted from Amibroker version

// --- settings
// per = 10 //(moving average periods for calculation)
// --- end of settings

mma = average[per,1](close)
smma = average[per](mma)

impetmma= mma-mma[1]
impetsmma= smma-smma[1]

divma=abs(mma-smma)

averimpet=(impetmma+impetsmma)/2

number=averimpet
pow=3
result=0
i=1
while i<pow do
 if i=1 then
  result=number
 endif
 result=result*number
 i=i+1
wend

tdf=divma*result

ntdf = tdf/highest[per*3](abs(tdf))

return ntdf coloured by ntdf style(histogram), 0 as "level 0"