

Trend indicator (Evrett Rogers) and Buy/Sell trading signals
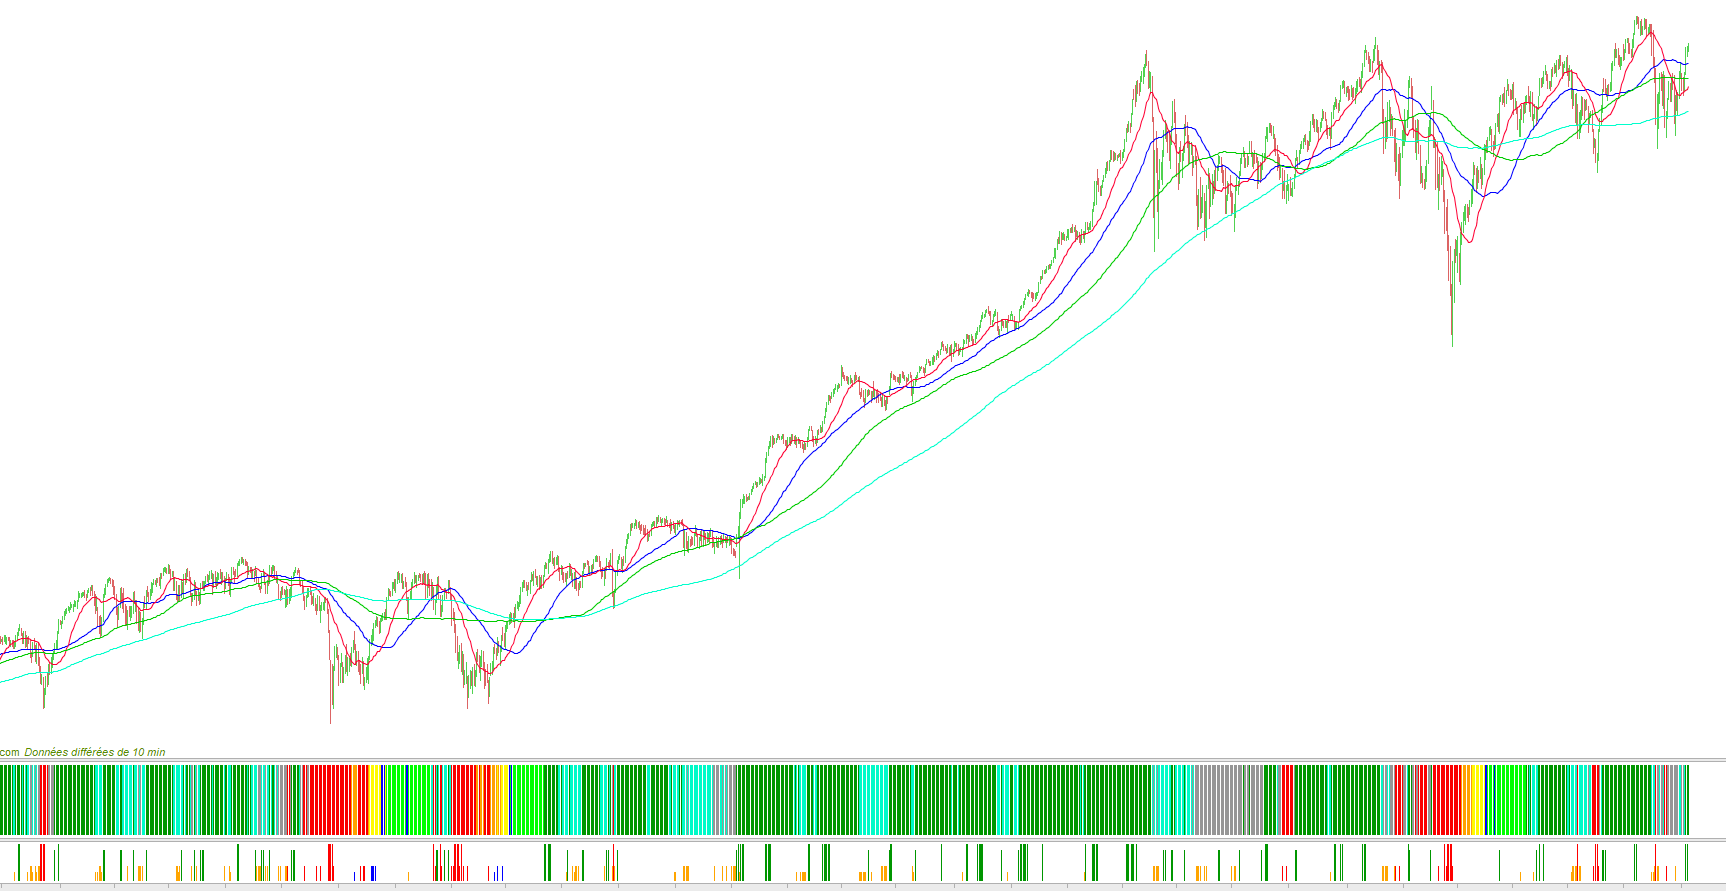
First indicator:
It uses moving averages, and following their knitting with the price itself gives an indication of the cycle. Trend indicator inspired by the diffusion curve innovation of Evrett Rogers (innovator, first follower, early majority, late majority, latecomer).
It gives an indication of the current cycle and thus maximize the probability of gain in this placing when the cycle is (yellow, opportunity) or (blue, reversal of trend).
From a more technical view, the opportunity phase is the the opening of the stochastic of the unit of higher timeframe (in other words one could have put indicator = stochastic with [50,10] and style (point, 0.5))
- The red phase is bearish, the price is below all moving averages.
- the orange phase is a technical rebound, ie the price has crossed the MM20 (this translates into a stochastic above the line H 50 but the macd still under the line H 0)
- the yellow phase is the opportunity phase, the price crosses the MM50, the macd crosses the line 0.
- the blue phase, reversal of the trend means that the price now crosses the MM100 while staying under the MM200, it is the so-called intermediate zone of “knitting”
- light green phase, the price is above the MM200, the trend is bullish but the MM50 (line 0 macd is still under the MM200).
- dark green phase, the price is above the MM200 is the MM50 also.
- green bottle phase, the price consolidates, either it passed under the MM20 or under the MM50 but it is above the MM100. This means a consolidation, a pullback or an end of cycle to come.
- the gray phase is neutral, ie the price is below the MM100 but above the MM200. it is either a cycle end, a wait before leaving congestion ….
//Indicateur tendance
MM20=average[20](close)
MM50=average[50](close)
MM100=average[100](close)
MM200=average[200](close)
//rouge (baissier prix sous moyenne mobile 200)
c1= (close<MM200)
if c1 then
Indicateur=1
r=250
g=0
b=0
ENDIF
//orange( rebond technique)
c2= c1 and(MM20<close)
if c2 then
Indicateur=1
r=255
g=160
b=0
ENDIF
//jaune (phase1 nouveau cycle)
c3= c1 and(MM50<close)and(mm50<mm200)and(close<mm200)
if c3 then
Indicateur=1
r=800
g=250
b=0
ENDIF
//vert fluo ( phase 2 nouveau cycle)
c4= (MM200<close)and(MM50<close)and(MM50<MM200)
if c4 then
Indicateur=1
r=0
g=300
b=0
ENDIF
//vert foncé ( au dessus de tte moyenne mobile, cycle mur)
C5= (MM200<MM50)and(MM50<close)and(MM20<close)
if c5 then
Indicateur=1
r=0
g=150
b=0
ENDIF
//bleu (retournement de tendance)
c6= (MM100<MM200) and(MM50<MM200)and (close<MM200)and(MM100<close)and(MM50<MM100)
if c6 then
Indicateur=1
r=0
g=0
b=300
ENDIF
//bleu (retournement de tendance 2 )
c6bis= (MM100<MM200) and(MM50<MM200)and (close<MM200)and(MM50<close)and(MM100<MM50)
if c6bis then
Indicateur=1
r=0
g=0
b=300
ENDIF
//gris (phase 5 affaiblissement ou retournement à la baisse, neutre)
c7= (MM200<close) and(close<MM100)and (MM200<MM100)and(MM200<MM50)
if c7 then
Indicateur=1
r=150
g=150
b=150
ENDIF
//bleu bouteille (consolidation)
c8=(MM200<MM50)and(MM200<close)and(MM100<close)and((close<MM50)or(close<MM20))
if c8 then
Indicateur=1
r=0
g=250
b=200
ENDIF
RETURN indicateur coloured(r,g,b)style(histogram)
The second code is trading signals indicator telling us when to buy or sell the market:
Below the MM200 there is no buy signal. It starts in the technical rebound by plotting a small blue histogram and that until the opportunity phase, its corresponds to the price that hits the upper Bollinger and then gives a signal that an interest is brought to the title (the probability of winning is maximum). Then the signal becomes green, and the larger the histogram, the stronger the signal. There are also signals in the code related to the crossing of the MM50, this means that the macd returns the line 0 is that there is a probable bullish recovery.
Indicateur=0

MM20=average[20](close)
MM50=average[50](close)
MM30E=exponentialaverage[30](close)
MM200=average[200](close)
MM100=average[100](close)
MM4=average[4](close)

p = 20
dev = 2
BollSup =Average[p](close)+dev*std[p](close)
BollInf = Average[p](close)-dev*std[p](close)
c000=   (MM50<MM200)and(MM30E<MM50)and(MM200<close)and(MM4<MM200)
if c000 then
Indicateur=1
r=0
g=150
b=0
ENDIF
c00=  (MM200<close) and(MM30E<MM50)and( MM50<close)and(MM4<MM50)
if c00 then
Indicateur=1
r=0
g=150
b=0
ENDIF
c0=  (MM200<close) and (MM200<MM50)and(MM50<MM30E)and(MM30E<close)and(MM4<MM30E)
if c0 then
Indicateur=1
r=0
g=150
b=0
ENDIF
//vert, foncé signal achat
c1=  (BollSup<close)and (MM200<MM50)and(MM50<close)and(MM20<close)
if c1 then
Indicateur=1.2
r=0
g=150
b=0
ENDIF
//vert,  fonce signal achat tendance precoce (vert fluo)
c2biss=  (BollSup<high) and (MM200<close)and(MM50<close)and(MM50<MM200)and(close<open)
if c2biss then
Indicateur=0
r=0
g=0
b=0
ENDIF
//vert,  fonce signal achat tendance precoce (vert fluo)
c2bis=  (BollSup<close) and (MM200<close)and(MM50<close)and(MM50<MM200)
if c2bis then
Indicateur=1
r=0
g=150
b=0
ENDIF
//bleu, signal préachat pendant rebond technique (orange)
c3= (close<MM200)and(MM20<close)and (BollSup<high)
if c3 then
Indicateur=0.3
r=0
g=0
b=300
ENDIF
//bleu, signal preachat pendant phase relance (jaune)
c4=(MM50<close)and(mm50<mm200)and(close<mm200)and (BollSup<high)
if c4 then
Indicateur=0.5
r=0
g=0
b=300
ENDIF
//bleu, signal preachat pendant phase de retournement (bleu)
c5= (MM100<MM200) and(MM50<MM200)and (close<MM200)and(MM100<close)and(MM50<MM100)and (BollSup<high)
if c5 then
Indicateur=0.5
r=0
g=0
b=300
ENDIF
//bleu, signal preachat tendance neutre (gris)
c7= (MM200<close) and(close<MM100)and (MM200<MM100)and(MM200<MM50)and (BollSup<high)
if c7 then
Indicateur=0.3
r=0
g=0
b=300
ENDIF

//orange, signal prevente en tendance consolidation (vert bouteille)
c8bis=(MM200<MM50)and(MM200<close)and(MM100<close)and((close<MM50)or(close<MM20))and(low < BollInf)
if c8bis then
Indicateur=0.5
r=255
g=165
b=0
ENDIF
//orange, signal prevente en tendance consolidation (vert bouteille)
c8bis=(MM200<MM50)and(MM200<close)and(MM100<close)and((MM50<close)and(close<MM20))and( BollInf<close)and(low < BollInf)
if c8bis then
Indicateur=0.3
r=255
g=165
b=0
ENDIF
//orange, signal prevente en tendance consolidation (vert bouteille)
c8biss=(MM200<MM50)and(MM200<close)and(MM100<close)and((MM50<close)and(close<MM20))and( close<BollInf)
if c8biss then
Indicateur=0.3
r=255
g=165
b=0
ENDIF
//orange, signal prevente en tendance neutre (gris)
c9= (MM200<close) and(close<MM100)and (MM200<MM100)and(MM200<MM50)and (low<BollInf)and(MM200<low)
if c9 then
Indicateur=0.5
r=255
g=165
b=0
ENDIF
//rouge, signal prevente en tendance neutre (gris)
c9bis= (MM200<close) and(close<MM100)and (MM200<MM100)and(MM200<MM50)and (low<BollInf)and(low<MM200)
if c9bis then
Indicateur=0.5
r=255
g=165
b=0
ENDIF
//orange, signal prevente en tendance neutre (gris)
c9biss= (MM200<close) and(close<MM100)and (MM200<MM100)and(MM200<MM50)and (close<BollInf)
if c9biss then
Indicateur=0.5
r=255
g=165
b=0
ENDIF
//rouge, signal vente en tendance declin (rouge)
c10= (close<MM200)and (low<BollInf)
if c10 then
Indicateur=0.5
r=255
g=0
b=0
ENDIF
//rouge, signal vente en tendance declin (rouge)
c10bis= (close<MM200)and (close<BollInf)
if c10bis then
Indicateur=1.2
r=255
g=0
b=0
ENDIF
//orange, signal vente en tendance declin (rouge)*****
c10biss= (MM200<close)and (low<BollInf)and(MM50<close)
if c10biss then
Indicateur=0.3
r=255
g=165
b=0
ENDIF

//orange, signal prevente en tendance consolidation (vert bouteille)
c8bisss=(MM200<MM50)and(MM200<close)and(MM100<close)and((MM50<close)and(close<MM20))and( BollInf<close)and(low<BollInf)
if c8bisss then
Indicateur=0.3
r=255
g=165
b=0
ENDIF
//vert bouteille signal achat
c8bisbis=(MM200<MM50)and(MM200<close)and(MM100<close)and((close<MM50)or(close<MM20))and( BollSup<high)and(open<close)
if c8bisbis then
Indicateur=0.5
r=0
g=0
b=300
ENDIF


RETURN indicateur coloured(r,g,b)style(histogram)