The Trend Levels is a technical indicator designed to identify and visually represent trend changes and dynamic support and resistance levels on price charts. This indicator helps traders detect key market moments through reference lines, labels, and arrows that clearly signal direction changes.
It is a valuable tool for both intraday traders and those who operate on higher timeframes.
How the Indicator Works
1. Key Value Calculations
The indicator calculates the highest (hi) and lowest (lo) values over a user-defined period using the length parameter.
These values serve as references to determine when a new high or low is reached, potentially indicating a trend reversal.
2. Trend Direction
The trend direction is determined by comparing the highest (hi) and lowest (lo) values with recent highs and lows:
- Uptrend (
trend = 1): occurs when the price reaches a new high within the defined period. - Downtrend (
trend = -1): is triggered when the price hits a new low within the defined period.
This trend change is key to identifying significant turning points in the market.
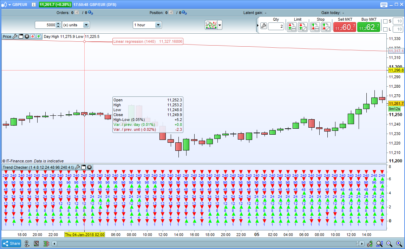
3. Drawing Trend Change Arrows
When the indicator detects a trend change, it draws arrows to mark these key points:
- Up arrow (lime green): signals the start of an uptrend.
- Down arrow (fuchsia): marks the beginning of a downtrend.
These signals allow traders to visually identify moments when the price may initiate a significant new movement.
4. Dynamic Level Calculations
From the moment a trend change occurs, the indicator calculates the following levels:
h1(upper level): the highest value since the trend began.l1(lower level): the lowest value since the trend began.m1(mid-level): the average between theh1andl1levels.
These levels help identify dynamic support and resistance zones on the chart, providing clear visual references for technical analysis.
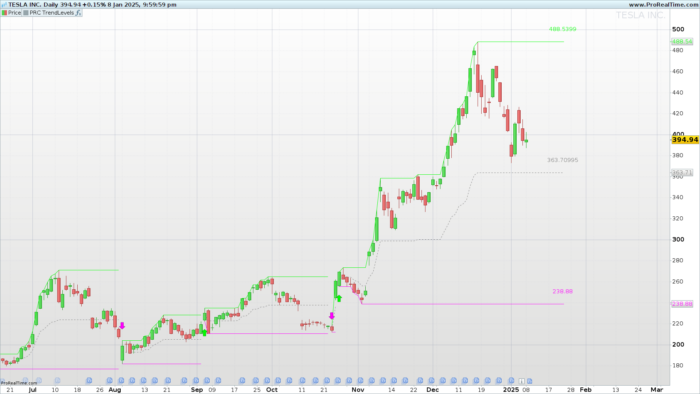
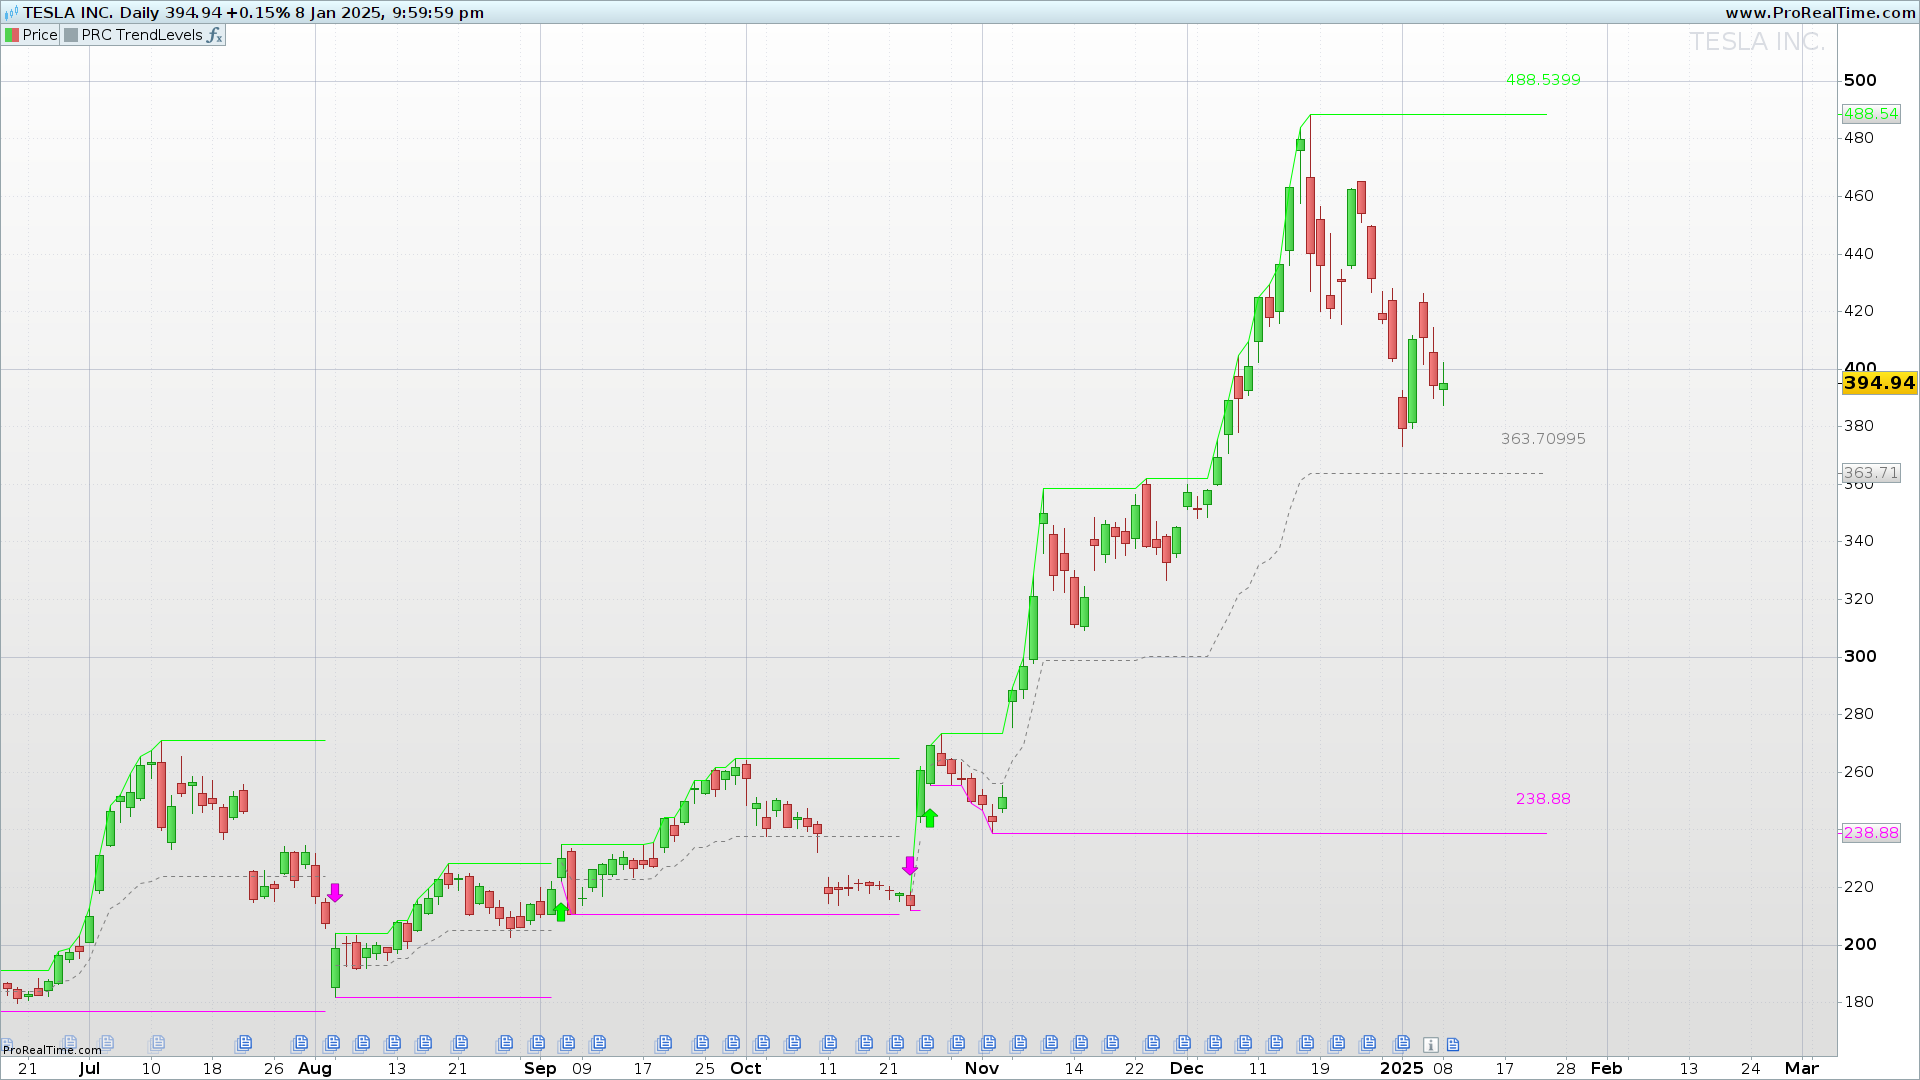
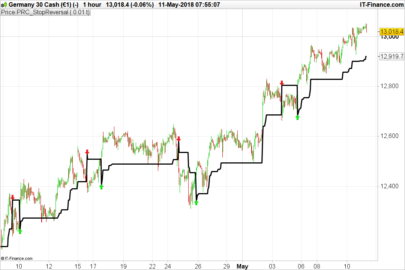
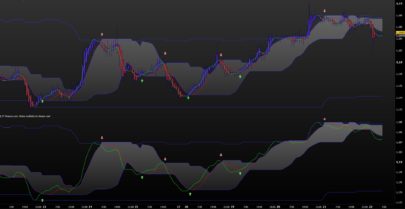
Visual Interpretation on the Chart
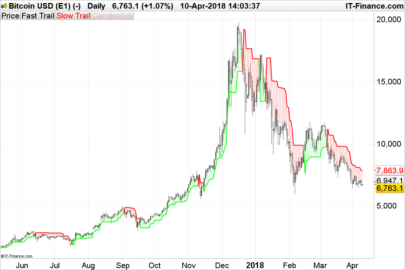
- Reference Lines
The Trend Levels indicator draws three horizontal reference lines:h1(upper line): displayed in lime green.l1(lower line): displayed in fuchsia.m1(mid-line): displayed in gray with a dotted style.
- Text and Labels
Next to each line, in the lastbarindex, the indicator displays a label showing the value of each level (#h1#,#l1#,#m1#).
Indicator Configuration
Customizable Parameters
length: The number of bars used to calculate highs and lows (default value: 30).
This parameter allows the analysis period to be adjusted for different timeframes, ranging from intraday charts to daily charts.
Code Trend Levels indicator
|
1 2 3 4 5 6 7 8 9 10 11 12 13 14 15 16 17 18 19 20 21 22 23 24 25 26 27 28 29 30 31 32 33 34 35 36 37 38 39 40 41 42 43 44 45 46 47 48 49 50 51 52 53 54 55 56 57 58 |
//---------------------------------------------------// //PRC Trend Levels //version = 0 //10.01.24 //Ivan Gonzalez @ www.prorealcode.com //Sharing ProRealTime knowledge //---------------------------------------------------// // inputs //---------------------------------------------------// length=30 atr=averagetruerange[14](close) //---------------------------------------------------// // Highest and Lowest values //---------------------------------------------------// hi=highest[length](high) lo=lowest[length](low) //---------------------------------------------------// // Trend direction calculation //---------------------------------------------------// if hi=high then trend=1 elsif lo=low then trend=-1 endif //---------------------------------------------------// // Indicator calculation //---------------------------------------------------// if trend <> trend[1] then bars=1 a=0 if trend=1 then drawarrowUp(barindex,low-atr)coloured("lime") elsif trend=-1 then drawarrowdown(barindex,high+atr)coloured("fuchsia") endif else bars=bars+1 a=255 endif if bars>0 then h1=highest[bars](high) l1=lowest[bars](low) m1=(h1+l1)/2 endif //---------------------------------------------------// // Last levels //---------------------------------------------------// if islastbarupdate then drawsegment(barindex,h1,barindex+10,h1)coloured("lime",a) drawsegment(barindex,l1,barindex+10,l1)coloured("fuchsia",a) drawsegment(barindex,m1,barindex+10,m1)coloured("grey",a)style(dottedline3) drawtext("#h1#",barindex+10,h1+0.5*atr)coloured("lime",a) drawtext("#l1#",barindex+10,l1+0.5*atr)coloured("fuchsia",a) drawtext("#m1#",barindex+10,m1+0.5*atr)coloured("grey",a) endif //---------------------------------------------------// return h1 coloured("lime",a), l1 coloured("fuchsia",a), m1 coloured("grey",a)style(dottedline3) |
Conclusion
The Trend Levels Indicator is an effective tool for identifying key dynamic support and resistance zones and detecting trend changes in a visual and precise way. By combining reference lines and arrows that highlight market turning points, this indicator provides traders with a clear view of entry and exit opportunities.
It is recommended to adjust the length parameter according to the timeframe and asset being analyzed to maximize the indicator’s effectiveness in different market contexts.
Share this
No information on this site is investment advice or a solicitation to buy or sell any financial instrument. Past performance is not indicative of future results. Trading may expose you to risk of loss greater than your deposits and is only suitable for experienced investors who have sufficient financial means to bear such risk.
ProRealTime ITF files and other attachments :
Find other exclusive trading pro-tools on ![]()
PRC is also on YouTube, subscribe to our channel for exclusive content and tutorials


Grazie Ivan, ottimo indicatore
posso chiedere, per favore, una strategia che apre posizioni long con freccia verde e short con la fucsia?
Grazie
thanks! maybe I could test it