
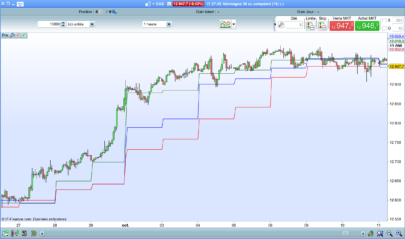
This indicator uses retracement periods of (23,38,50,61)
The indicator calculates as follows(Highest[X](high) + Lowest[X](low) + Close) / 3
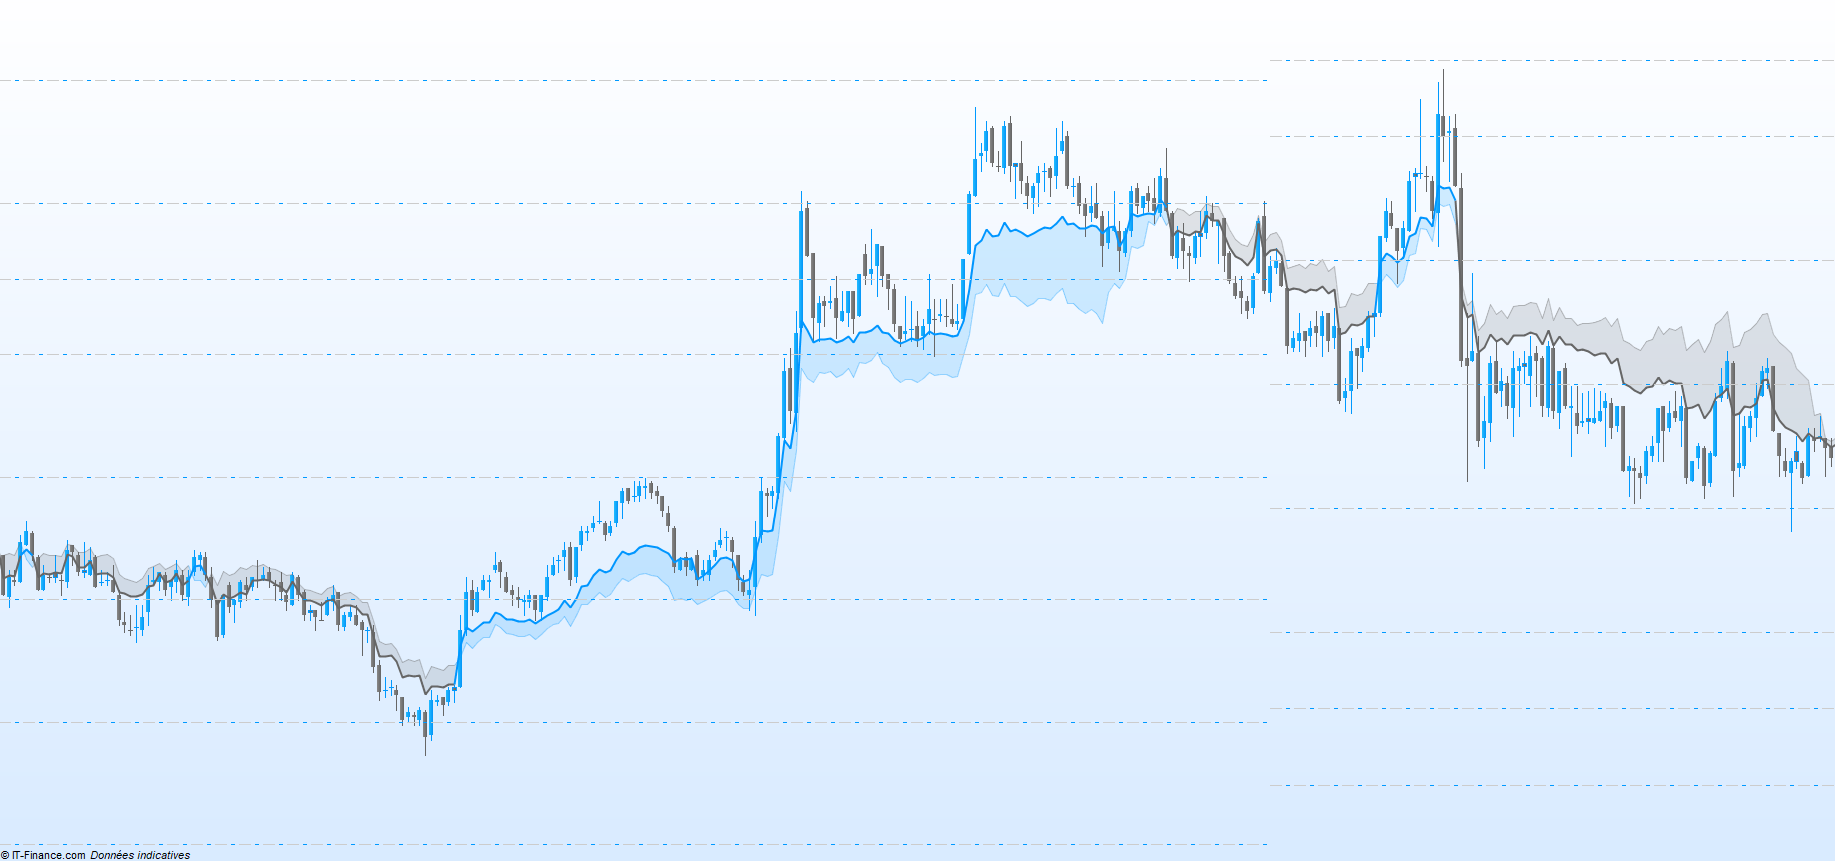
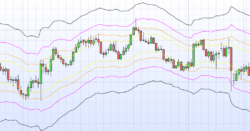
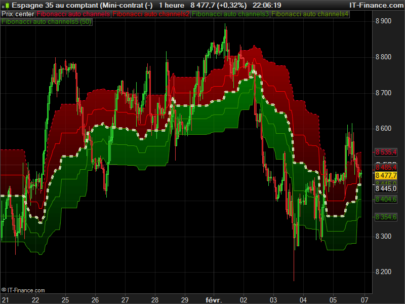
Once the levels are detected, the code averages the retracements, this way we get a probable pivot point level.
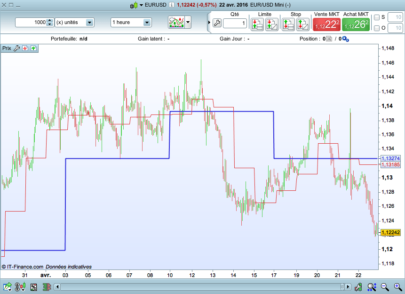
This level is represented by the thickest line of the indicator.
The thinnest line corresponds to the lowest or highest pivot point, which is then useful for determining the directional bias, but also as a pivot level.
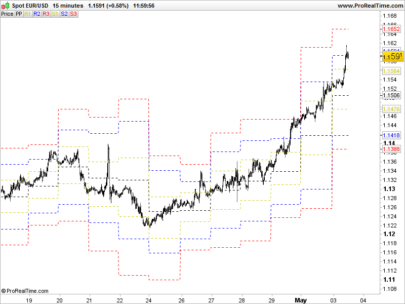
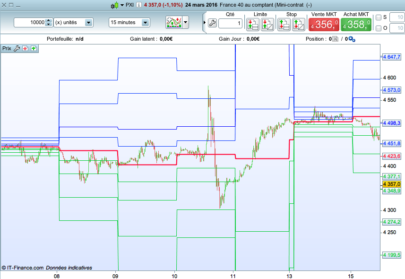
The use of this indicator is particularly effective for confirming rebound levels with fibonacci pivot points.
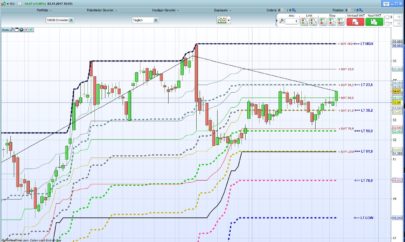
In this way, the approach of the price on a pivot point in confirmation with the “Trend Line Fibonacci” indicator is interesting.
IV
|
1 2 3 4 5 6 7 8 9 10 11 12 13 14 15 16 17 18 19 20 21 22 23 24 25 26 27 28 29 30 31 32 33 34 35 36 37 38 39 40 41 42 43 44 45 46 47 48 49 50 51 52 53 54 55 56 57 58 59 60 61 62 63 64 65 66 67 68 69 70 71 72 73 74 75 76 77 78 79 80 81 82 83 84 85 86 87 88 89 90 91 92 93 94 95 96 97 98 99 100 101 102 103 104 105 106 107 108 109 110 111 112 113 114 115 116 117 118 119 120 121 122 123 124 125 126 127 128 129 130 131 132 133 134 135 136 137 138 139 140 141 142 |
// //=/===============/=//=/===============/=//=/ Indicateur Fibonacci // // //=/===============/=//=/===============/=//=/ Detection des plus Haut et Bas // //=/ Ratio de 23 x23xH = highest[23](high) x23xL = lowest[23](low) //=/ Ratio de 38 x38xH = highest[38](high) x38xL = lowest[38](low) //=/ Ratio de 50 x50xH = highest[50](high) x50xL = lowest[50](low) //=/ Ratio de 61 x61xH = highest[61](high) x61xL = lowest[61](low) // //=/===============/=//=/===============/=//=/ Zone de Pivot // //=/ Ratio de 23 x23x = (x23xH+x23xL+close)/3 //=/ Ratio de 38 x38x = (x38xH+x38xL+close)/3 //=/ Ratio de 50 x50x = (x50xH+x50xL+close)/3 //=/ Ratio de 61 x61x = (x61xH+x61xL+close)/3 //=/ Pivot Premier et Second xPxPremier = (x23x+x38x+x50x+x61x+close)/5 //=// xPxSecond = xPxPremier if close > xPxSecond and xPxSecond < xPxSecond[1] then xPxSecond = xPxSecond[1] //=// elsif close < xPxSecond and xPxSecond > xPxSecond[1] then xPxSecond = xPxSecond[1] endif //=/ Pivot Optimal xPxOptimal = (xPxSecond+xPxPremier) /2 // //=/===============/=//=/===============/=//=/ Zone Extreme // //=/ Extreme Haut if x23x => x38x and x23x => x50x and x23x => x61x then xExHaut = x23x //=// elsif x38x => x23x and x38x => x50x and x38x => x61x then xExHaut = x38x //=// elsif x50x => x23x and x50x => x38x and x50x => x61x then xExHaut = x50x //=// elsif x61x => x23x and x61x => x38x and x61x => x50x then xExHaut = x61x endif //=/ Extreme Bas if x23x =< x38x and x23x =< x50x and x23x =< x61x then xExBas = x23x //=// elsif x38x =< x23x and x38x =< x50x and x38x =< x61x then xExBas = x38x //=// elsif x50x =< x23x and x50x =< x38x and x50x =< x61x then xExBas = x50x //=// elsif x61x =< x23x and x61x =< x38x and x61x =< x50x then xExBas = x61x endif //=/ Point de Tendance if close > xExHaut and close > xExBas then xPxT = 1 //=// elsif close < xExHaut and close < xExBas then xPxT = -1 endif //=// if xPxT = 1 then xPxTendance = xExBas //=// elsif xPxT = -1 then xPxTendance = xExHaut endif // //=/===============/=//=/===============/=//=/ Coloration des ligne // //=/ Ratio de 23 if xPxT = 1 then R = 0 G = 150 B = 255 T = 100 //=// elsif xPxT = -1 then R = 102 G = 102 B = 102 T = 100 endif // //=/===============/=//=/===============/=//=/ Fin // return xPxTendance coloured(R,G,B,T) style (line,1) as "Tendance", xPxOptimal coloured(R,G,B,255) style (line,2) as "Optimal" |
Share this
No information on this site is investment advice or a solicitation to buy or sell any financial instrument. Past performance is not indicative of future results. Trading may expose you to risk of loss greater than your deposits and is only suitable for experienced investors who have sufficient financial means to bear such risk.
ProRealTime ITF files and other attachments :
Find other exclusive trading pro-tools on ![]()
PRC is also on YouTube, subscribe to our channel for exclusive content and tutorials


You can find the V2 version here : https://www.prorealcode.com/topic/trend-line-fibonacci-v2/
The V2 is much better !
Thanks IV
Do you think it can be used on stonk too ?
I don’t speak English and the translation is not clear.
Do you have a different turn of phrase?
stonk ?
Thanks very much for sharing, look forward to testing this idea out.