This indicator only works on PRT v11 onwards.
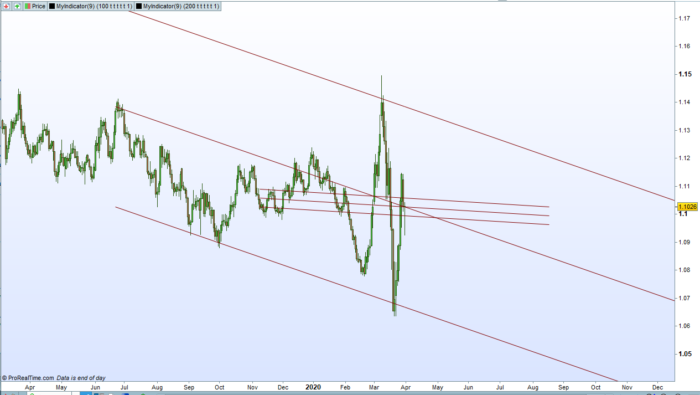
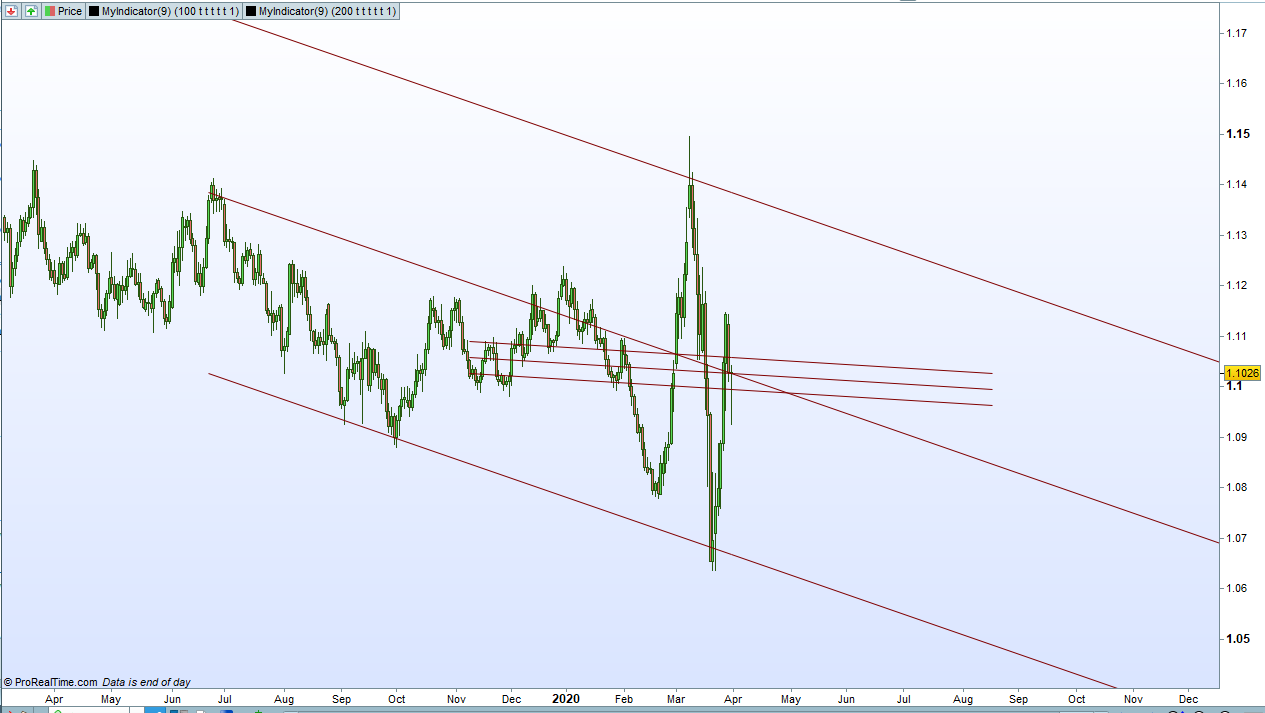
This indicator draws trend lines from the last bar on the chart based on the previous p candles.
You can also draw channels above and below the main trend line. The steeper the trend line the further apart these are and the shallower the trend line the closer together they are. Their spacing can be adjusted using the ‘Multiple’ setting. The channel lines can be added or removed with the ‘Upper’ and ‘Lower’ settings.
The trend lines and channel lines are projected into the future by p bars and into the past by p bars. These can be removed or displayed with the ‘Past’ and ‘Future’ settings.
The calculations can be done using either pure price movements of price movements as a percentage of the previous close. The ‘Percentage’ setting allows you to choose which.
The trend lines are green if they are rising and red if they are declining.
If you apply the indicator multiple times to your price chart with different settings for ‘p’ then you can get a feeling for short, medium and long term trends and be able to visualise where price might be in the future.
As always I advise downloading and importing to get full functionality.
|
1 2 3 4 5 6 7 8 9 10 11 12 13 14 15 16 17 18 19 20 21 22 23 24 25 26 27 28 29 30 31 32 33 34 35 36 37 38 39 40 41 42 43 44 45 46 47 48 49 50 51 52 53 54 55 56 57 58 59 60 61 |
//Trend Lines and Trend Channel //PRT v11 //By Vonasi //Date: 20200401 if p < barindex then if barindex >= p-1 then if percentage then $diff[barindex] = ((close-open)/(close[1])) else $diff[barindex] = close-open endif if islastbarupdate then mydiff = 0 for a = 0 to p-1 if percentage then mydiff = mydiff+($diff[barindex-a]*close) else mydiff = mydiff+($diff[barindex-a]) endif next r = 128 g = 0 if mydiff >=0 then r = 0 g = 128 endif if past then drawsegment(barindex,close,barindex-p,close - mydiff)coloured(r,g,0) endif if future then drawsegment(barindex,close,barindex+p,close + mydiff)coloured(r,g,0) endif if upper then hh = abs(mydiff)*multiple if past then drawsegment(barindex,close+hh,barindex-p,close-mydiff+hh)coloured(r,g,0) endif if future then drawsegment(barindex,close+hh,barindex+p,close+mydiff+hh)coloured(r,g,0) endif endif if lower then ll = abs(mydiff)*multiple if past then drawsegment(barindex,close-ll,barindex-p,close-mydiff-ll)coloured(r,g,0) endif if future then drawsegment(barindex,close-ll,barindex+p,close+mydiff-ll)coloured(r,g,0) endif endif endif endif endif return |
Share this
No information on this site is investment advice or a solicitation to buy or sell any financial instrument. Past performance is not indicative of future results. Trading may expose you to risk of loss greater than your deposits and is only suitable for experienced investors who have sufficient financial means to bear such risk.
ProRealTime ITF files and other attachments :PRC is also on YouTube, subscribe to our channel for exclusive content and tutorials








Thank you Vonasi
An update to this indicator with some improvements and new features can now be found here:
https://www.prorealcode.com/topic/trend-lines-and-trend-channel-update/
Once you download it, how do you upload it into PRT?
thanks
How to import file page: in the help section of the website explains howto
import through the indicator page/window in the Proreal time
Buenas, no consigo que se me muestre en el chart de DAX. ¿Cómo procedo? Gracias.-