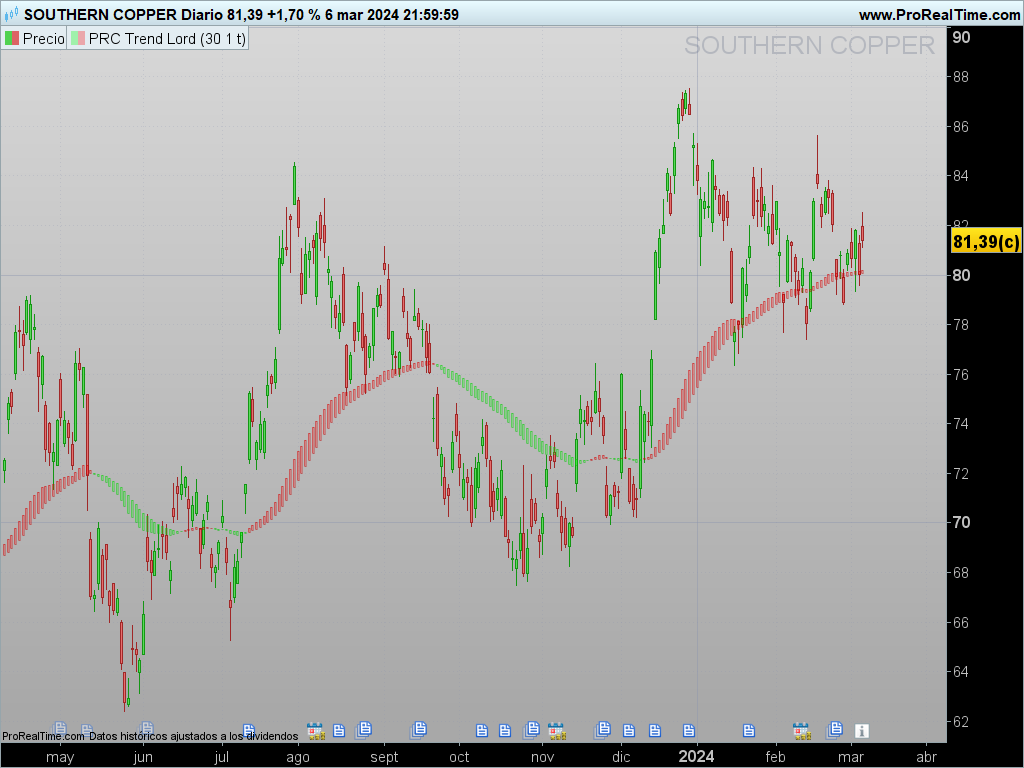
The Trend Lord indicator is a visual tool that enables traders to identify trends more intuitively by using custom candles. Unlike traditional candles, this indicator colors the candles according to the trend direction, making it easier to spot shifts or consolidation in price movements.
This article will guide you through the setup of the Trend Lord indicator and show you how to adjust its parameters to optimize it for your analysis needs. At the end, you’ll find the code required to implement it in ProRealTime.
1. Parameter Calculation and Configuration
The Trend Lord indicator structure includes several key parameters that control the behavior and visualization of the candles on the chart. These parameters affect aspects like the moving average calculation period and the smoothing method.
a) Moving Average Period (maperiod)
The maperiod parameter defines the number of bars used to calculate the moving average. This value determines the indicator’s sensitivity to price changes. A lower maperiod will make the indicator respond faster to price movements, while a higher value will reduce noise and highlight stronger trends only. This value is set to always be at least 1 in the code to avoid calculation errors.
b) Smoothed Moving Average (smoothedSMA)
The smoothedSMA parameter allows the use of a smoothed simple moving average. Enabling this option results in a smoother candle transition, which visually reduces volatility in the indicator. This is especially useful for those who prefer a cleaner look and like to identify trends with less abrupt movements.
c) Moving Average Method (mamethod)
This parameter defines the calculation method of the moving average applied in the indicator. Changing the mamethod allows trying different approaches and choosing the one that suits the market or asset being analyzed. ProRealTime offers various options for calculating moving averages, including simple and exponential, which can be applied in the code.
2. Defining Custom Candles in the Trend Lord
The Trend Lord indicator uses a unique approach to define its own “candles” based on average open, high, low, and close values, calculated according to the moving average and other parameters:
bufopen: Determines the open price of each candle. It is calculated accumulatively using thesrcvalue (which refers to the custom close).bufhigh: Represents the candle’s high price, equal to thebufopenvalue.buflow: Calculates the low price of each candle, smoothed using theSqLengthvalue, which is the square root ofmaperiod.bufclose: Represents the close of each candle, set equal to thebuflowvalue.
This custom calculation of the candles allows an alternative visualization of prices, where each candle behaves more fluidly than a traditional price candle.
3. Candle Colors According to Trend
A primary feature of the Trend Lord indicator is its color-coding of candles based on the trend direction:
- Green candles: Displayed when the open price (
bufopen) is higher than the close price (bufclose). This indicates a potential bullish trend. - Red candles: Displayed when the close price is higher than the open, suggesting a bearish trend.
This color-coding allows a quick visual interpretation of the trend, making it easy to identify the direction and potential changes. The candle color is a simple yet powerful representation, helping traders focus on the general price movement.
4. Implementing the Code in ProRealTime
Below is the code necessary to implement the Trend Lord indicator in ProRealTime. This code is written in the ProBuilder language, which is specific to the ProRealTime platform.
|
1 2 3 4 5 6 7 8 9 10 11 12 13 14 15 16 17 18 19 20 21 22 23 24 25 26 27 28 29 30 31 32 33 34 35 36 37 38 39 40 41 42 43 44 45 46 47 48 49 |
//PRC_Trend Lord //version = 0 //06.03.24 //Iván González @ www.prorealcode.com //Sharing ProRealTime knowledge ///inputs maperiod = 30 // periods smoothedSMA = 1 // calculations with smoothed simple moving average mamethod = 1 // method moving average src = customclose SqLength = round(sqrt(maperiod)) maperiod = MAX(maperiod, 1) if smoothedSMA then ///Candle definition IF BarIndex = 0 THEN bufopen = src buflow = bufopen bufhigh = bufopen bufclose = buflow ELSE bufopen = bufopen[1] + (src - bufopen[1]) / maperiod bufhigh = bufopen buflow = buflow[1] + (bufopen - buflow[1])/ Sqlength bufclose = buflow ENDIF else ///Candle definition bufopen = average[maPeriod,mamethod](src) bufhigh = bufopen buflow = average[Sqlength,mamethod](bufopen) bufclose = buflow endif ///Candle color if bufopen>bufclose then r=0 g=250 else r=250 g=0 endif ///Draw candles DRAWCANDLE(bufopen, bufhigh, buflow, bufclose)coloured(r,g,0,75) return |
This code defines the visual characteristics of the indicator. Each custom candle is calculated based on the type of moving average and smoothing method selected by the user. By changing the parameters maperiod, smoothedSMA, and mamethod, the user can adapt the indicator to their specific needs, adjusting the sensitivity and smoothness of the candles.
5. Conclusion and Usage Tips
The Trend Lord indicator is a valuable visual tool for detecting trends in financial markets. By employing a custom candle representation, it facilitates the identification of trend reversals and enables a focus on the general direction of price movements.
Usage Tips:
- Adjust
maperiodbased on the timeframe: If trading on short-term charts, consider reducing the period to capture quick changes. On long-term charts, a highermaperiodcan help identify predominant trends. - Try different moving average methods: Changing
mamethodallows experimenting with different calculation styles, which can provide alternative trend perspectives. - Use smoothed candles: Enabling
smoothedSMAcan reduce visual volatility, ideal for those who prefer stable and easy-to-interpret charts.
This indicator is especially useful in trending markets and less effective in sideways ranges, where color changes might occur frequently without indicating a clear trend. Like any other indicator, Trend Lord should be used as a complement to other technical analysis tools for more accurate results.
Share this
No information on this site is investment advice or a solicitation to buy or sell any financial instrument. Past performance is not indicative of future results. Trading may expose you to risk of loss greater than your deposits and is only suitable for experienced investors who have sufficient financial means to bear such risk.
ProRealTime ITF files and other attachments :
Find other exclusive trading pro-tools on ![]()
PRC is also on YouTube, subscribe to our channel for exclusive content and tutorials