Trend Trigger Factor was described by M.H. Pee in the Technical Analysis of Stocks and Commodities magazine in December, 2004.
From the author:
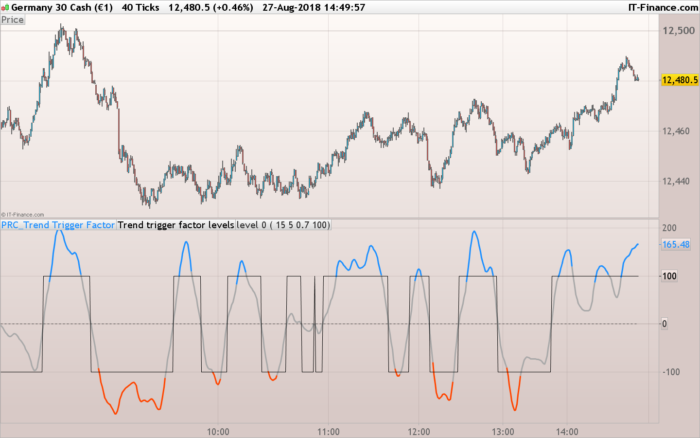
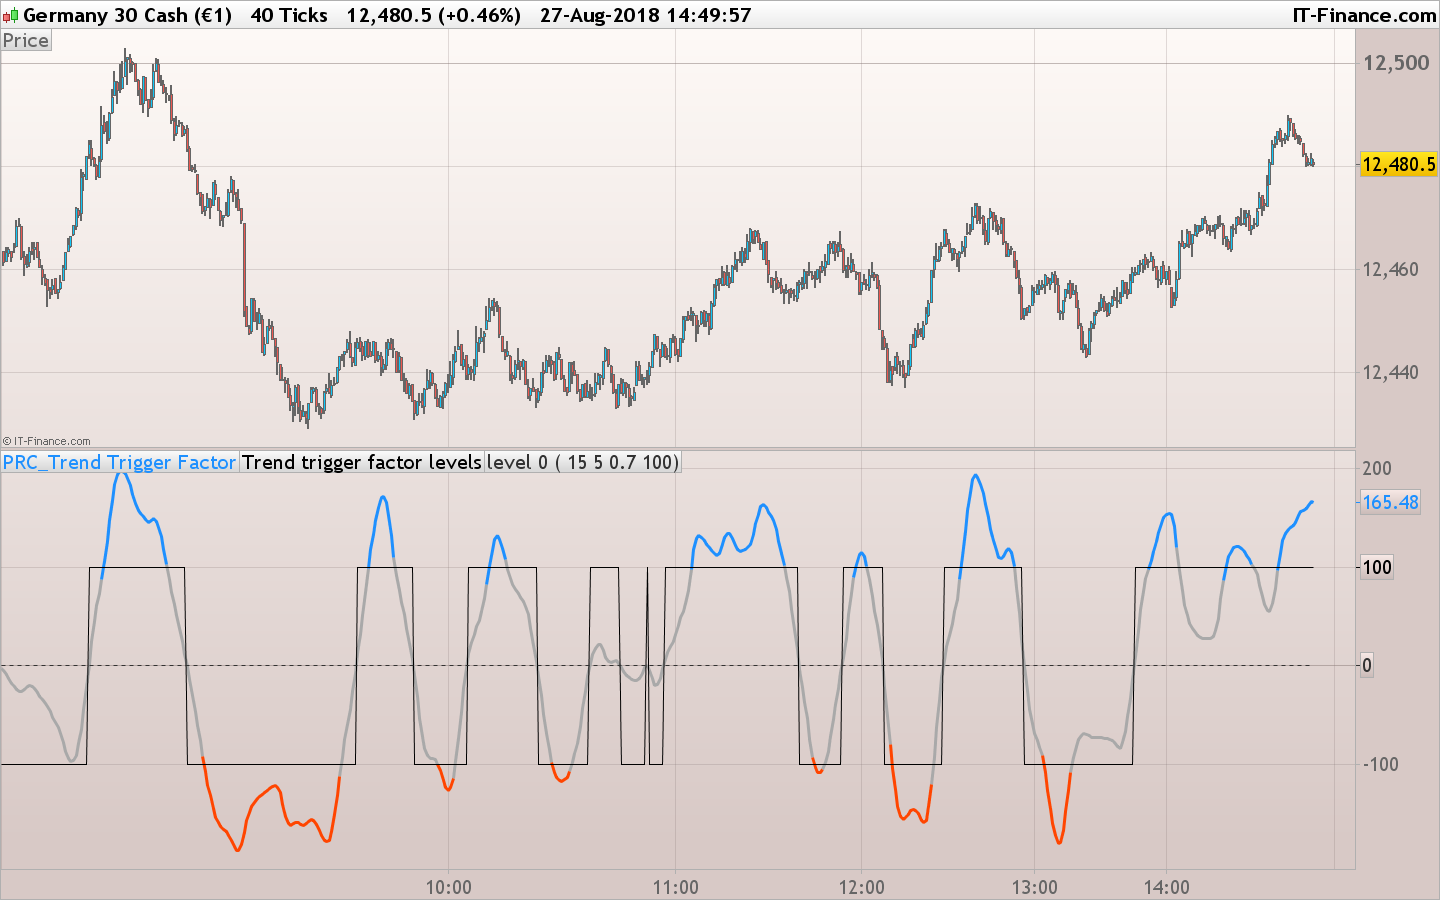
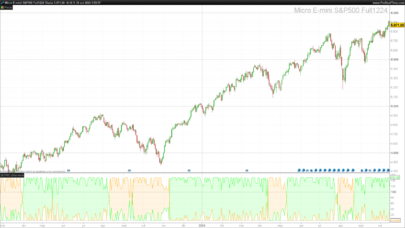
The TTF (Trend Trigger Factor) will help you long in an uptrend and short in an downtrend. This indicator allows you to follow the trend and capitalize on that rare nonrandom trend component of the markets.
Basically it calculates range from highest high and lowest low on 2 different time periods: a recent one and an older one, called buypower and sellpower and then apply the formula:
100*(BuyPower-SellPower)/(0.5*(BuyPower+SellPower))
to calculate the TTF.
The trend trigger is made with a fixed levels (that you can change in the setting), when the TTF is over the upper level, the trend is up and when it’s below the lower level, the trend is down.
In this version the TTF value is smoothed with a Wilson’s T3 average. It could be changed with your other preferred smoothing function if you want, just let me know..
|
1 2 3 4 5 6 7 8 9 10 11 12 13 14 15 16 17 18 19 20 21 22 23 24 25 26 27 28 29 30 31 32 33 34 35 36 37 38 39 40 41 42 43 44 45 46 47 48 49 50 51 52 53 54 55 56 57 58 59 60 61 62 63 64 65 66 67 |
//PRC_Trend Trigger Factor | indicator //27.08.2018 //Nicolas @ www.prorealcode.com //Sharing ProRealTime knowledge //converted from Metatrader5 version // --- settings inpPeriod = 15 // Period inpT3Period = 5 // T3 period Hot = 0.7 // T3 hot ({-1.5..1.5}) inpLevels = 100 // Levels at +- (nnn) // --- end of settings HighestHighRecent = highest[inpPeriod](high)[1] HighestHighOlder = highest[inpPeriod](high)[inpPeriod+1] LowestLowRecent = lowest[inpPeriod](low)[1] LowestLowOlder = lowest[inpPeriod](low)[inpPeriod+1] BuyPower = HighestHighRecent - LowestLowOlder SellPower = HighestHighOlder - LowestLowRecent ttf = 100*(BuyPower-SellPower)/(0.5*(BuyPower+SellPower)) // T3 price = ttf // Price Period = MAX(inpT3Period, 1) if barindex>Period then e1 = ExponentialAverage[Period](price) e2 = ExponentialAverage[Period](e1) e3 = ExponentialAverage[Period](e2) e4 = ExponentialAverage[Period](e3) e5 = ExponentialAverage[Period](e4) e6 = ExponentialAverage[Period](e5) b = Hot b2 = (b * b) b3 = (b * b * b) c1 = -b3 c2 = (3 * b2) + (3 * b3) c3 = (-6 * b2) - (3 * b) - (3 * b3) c4 = 1 + (3 * b) + b3 + (3 * b2) avg = c1 * e6 + c2 * e5 + c3 * e4 + c4 * e3 //levels if avg>0 then lev = inplevels else lev = -inplevels endif //colors r=169 g=169 b=169 if avg>inplevels then r=30 g=144 b=255 elsif avg<-inplevels then r=255 g=69 b=0 endif endif return avg coloured(r,g,b) style(line,3) , lev as "Trend trigger factor levels", 0 coloured(50,50,50) style(dottedline,1) as "level 0" |
Share this
No information on this site is investment advice or a solicitation to buy or sell any financial instrument. Past performance is not indicative of future results. Trading may expose you to risk of loss greater than your deposits and is only suitable for experienced investors who have sufficient financial means to bear such risk.
ProRealTime ITF files and other attachments :PRC is also on YouTube, subscribe to our channel for exclusive content and tutorials





UN GRAND MERCI POUR LES INDICATEURS
Interesting, Thank you! 🙂
Bonjour Nicolas ,
actuellement je me forme grace a vos videos tres tres bien expliques merci
j essaie depuis queques heures deja sans success de creer un screener qui me chercherait des actions compris entre un prix disons de
10$et de 30$ et un volume de 1 millions
avez vous par chance se type de code en votre possession
voila se que ja ecris en code sans prendre en compte le volume
variable1=nyse>=10
variable2=nyse=10,nyse<=30
et malheureusement j ai des erreurs de synthax
merci
Merci. ça n’est pas le lieu pour poser ce genre de question 🙂 Merci d’utiliser le forum ProScreener pour cela en créant un nouveau sujet: https://www.prorealcode.com/forum/prorealtime-forum-francais/support-proscreener/