

Trend Type Indicator
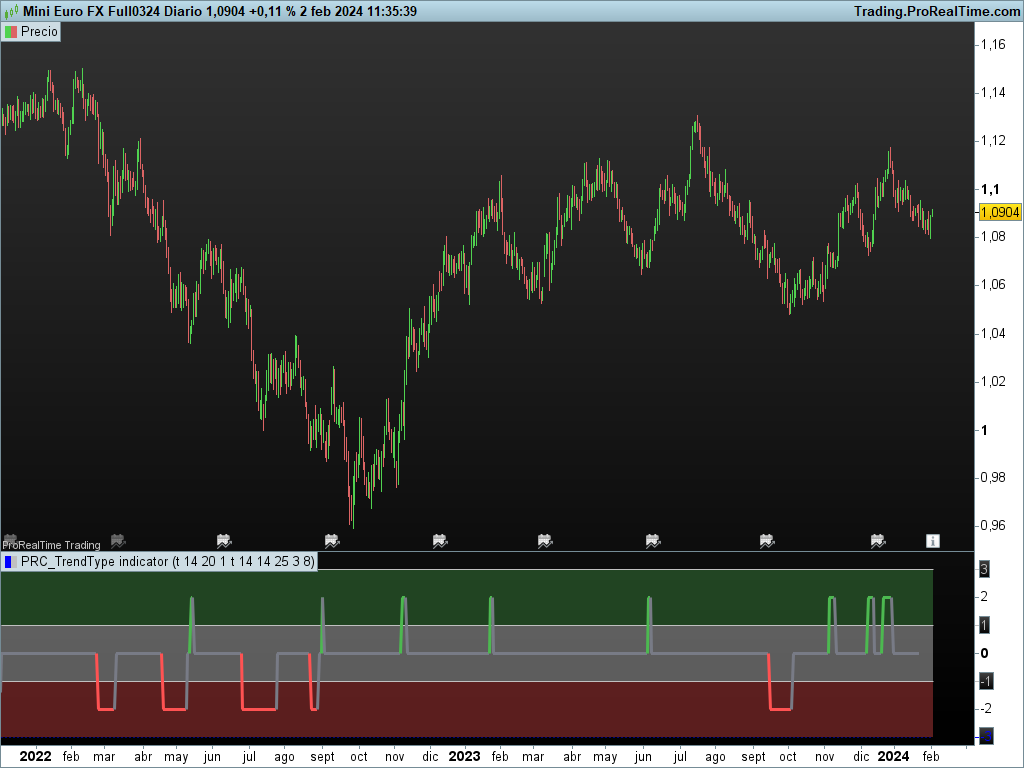
Trend Type Indicator usage:
The purpose of this indicator is to programmatically determine the type of price trend using technical analysis tools.
You can do a quick check on the asset’s higher and lower time frames. For example, if you are trading on an H1 chart, you can check the m5 chart to ensure that the trend is in the same direction and similarly check the H4 chart to ensure that the higher time frame price is also moving in the same direction.
If multiple time frame charts confirm a similar trend, then it is considered a very strong trend and ideal for Trend trading.
Remarks:
By default, the last status is related to 8 periods before the latest closing price.
Types of trends
The three basic types of trends are up, down, and sideways.
1. Uptrend
An uptrend describes the price movement of a financial asset when the overall direction is upward. The uptrend is composed of higher swing lows and higher swing highs.
Some market participants (“long” trend traders) only choose to trade during uptrends.
2. Downtrend
A downtrend refers to the price action of a security that moves lower in price as it fluctuates over time.
The downtrend is composed of lower swing lows and lower swing highs.
3. Sideways
A sideways trend is the horizontal price movement that occurs when the forces of supply and demand are nearly equal. This typically occurs during a period of consolidation before the price continues a prior trend or reverses into a new trend.
How it works:
Step 1: Sideways Trend Detection
In this step we want to distinguish the sideways trend from uptrend and downtrend. For this purpose, we use two common technical analysis tools: ATR and ADX.
1. Average True Range (ATR)
The average true range (ATR) is a technical analysis indicator that measures market volatility.
We also use a 20-period moving average of the ATR.
When the ATR is below the average of its last 20-periods, it means that the rate of price volatility has decreased and we conclude that the current trend is sideways.
2. Average Directional Index (ADX)
The average directional index (ADX) is a technical analysis indicator used by some traders to determine the strength of a trend.
The trend has strength when ADX is above 25.
So when the ADX is less than or equal to 25, there is no strong trend, and we conclude that the current type of trend is sideways.
Step 2: Detect uptrend from downtrend
If it turns out that the current price trend is not sideways, then it is either uptrend or downtrend.
For this purpose, we use plus and minus directional Indicators (+ DI & -DI).
A general interpretation would be that during a strong trend, when +DI is higher than -DI, it is an uptrend. When -DI is higher than +DI, it is a downtrend.
* Original description from author: BobRivera990
//PRC_TrendType | indicator
//version = 0
//02.02.2024
//Iván González @ www.prorealcode.com
//Sharing ProRealTime knowledge
/////////////////DEFAULT PARAMETERS//////////////////////////////
useAtr = 1 //boolean// Use Average True Range (ATR) to detect Sideways Movements
atrlen = 14 //integer// length of the Average True Range (ATR) used to detect Sideways Movements
atrMalen = 20 //integer// length of the moving average of the ATR used to detect Sideways Movements
Matype = 1 // Type of the moving average of the ATR used to detect Sideways Movements
useAdx = 1 //boolean// Use Average Directional Index (ADX) to detect Sideways Movements
adxlen = 14 //integer// length of the Average Directional Index (ADX) used to detect Sideways Movements
dilen=14 //integer// length of the Plus and Minus Directional Indicators (+DI & -DI) used to determine the direction of the trend
adxlim=25 //integer// A level of ADX used as the boundary between Trend Market and Sideways Market
smooth=3 //integer// Factor used for smoothing the oscillator
lag=8 //integer// lag used to match indicator and chart

///////////////////////////INDICATORS///////////////////////////
/////ATR
atr = averagetruerange[atrlen]
atrMa = average[atrMalen,Matype](atr)

/////ADX, +DI, -DI
myadx = adx[adxlen]
plus = DIplus[dilen](close)
minus = diminus[dilen](close)
//////////////////////////CONDITIONS////////////////////////////
/////Sideways Movement condition (based on ATR or ADX)
cndSidwayss1 = useAtr and atr <= atrMa
cndSidwayss2 = useAdx and myadx <= adxlim
cndSidways = cndSidwayss1 or cndSidwayss2

/////Uptrend/downtrend conditions
cndUp = plus > minus
cndDown = minus >= plus

/////Determine type of trend
if cndSidways then
trendType = 0
elsif cndUp then
trendType = 2
else
trendType = -2
endif

//////////////Calculate the smoothed trend type oscillator////////////
smoothtype = round(average[smooth](trendtype)/2)*2

///Oscillator Color
IF smoothtype = 2 then
r = 76
g = 185
b = 80
elsif smoothtype = -2 then
r = 255
g = 82
b = 82
else
r = 120
g = 123
b = 134
endif
///Draw oscilator (offset=lag)
drawsegment(barindex[lag],smoothtype,barindex[lag+1],smoothtype[1])style(line,3)coloured(r,g,b)

/////////////////////////////////BANDS//////////////////////////
band3 =  3
band2 =  1
band1 = -1
band0 = -3
COLORBETWEEN(band2,band3,76,175,80,90)
COLORBETWEEN(band1,band2,255,255,255,90)
COLORBETWEEN(band0,band1,255,82,82,90)

return band0 as "Band0", band1 as "Band1", band2 as "Band2", band3 as "Band3"
