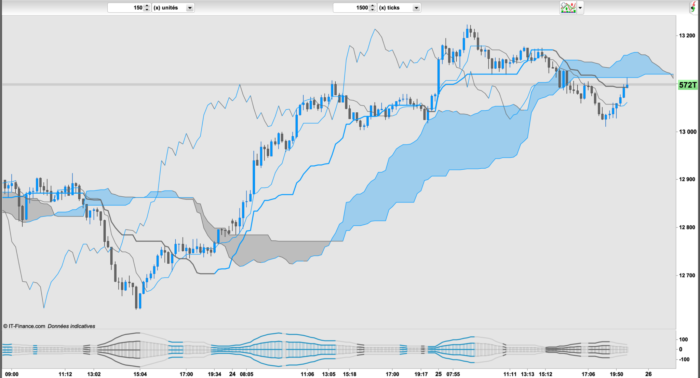
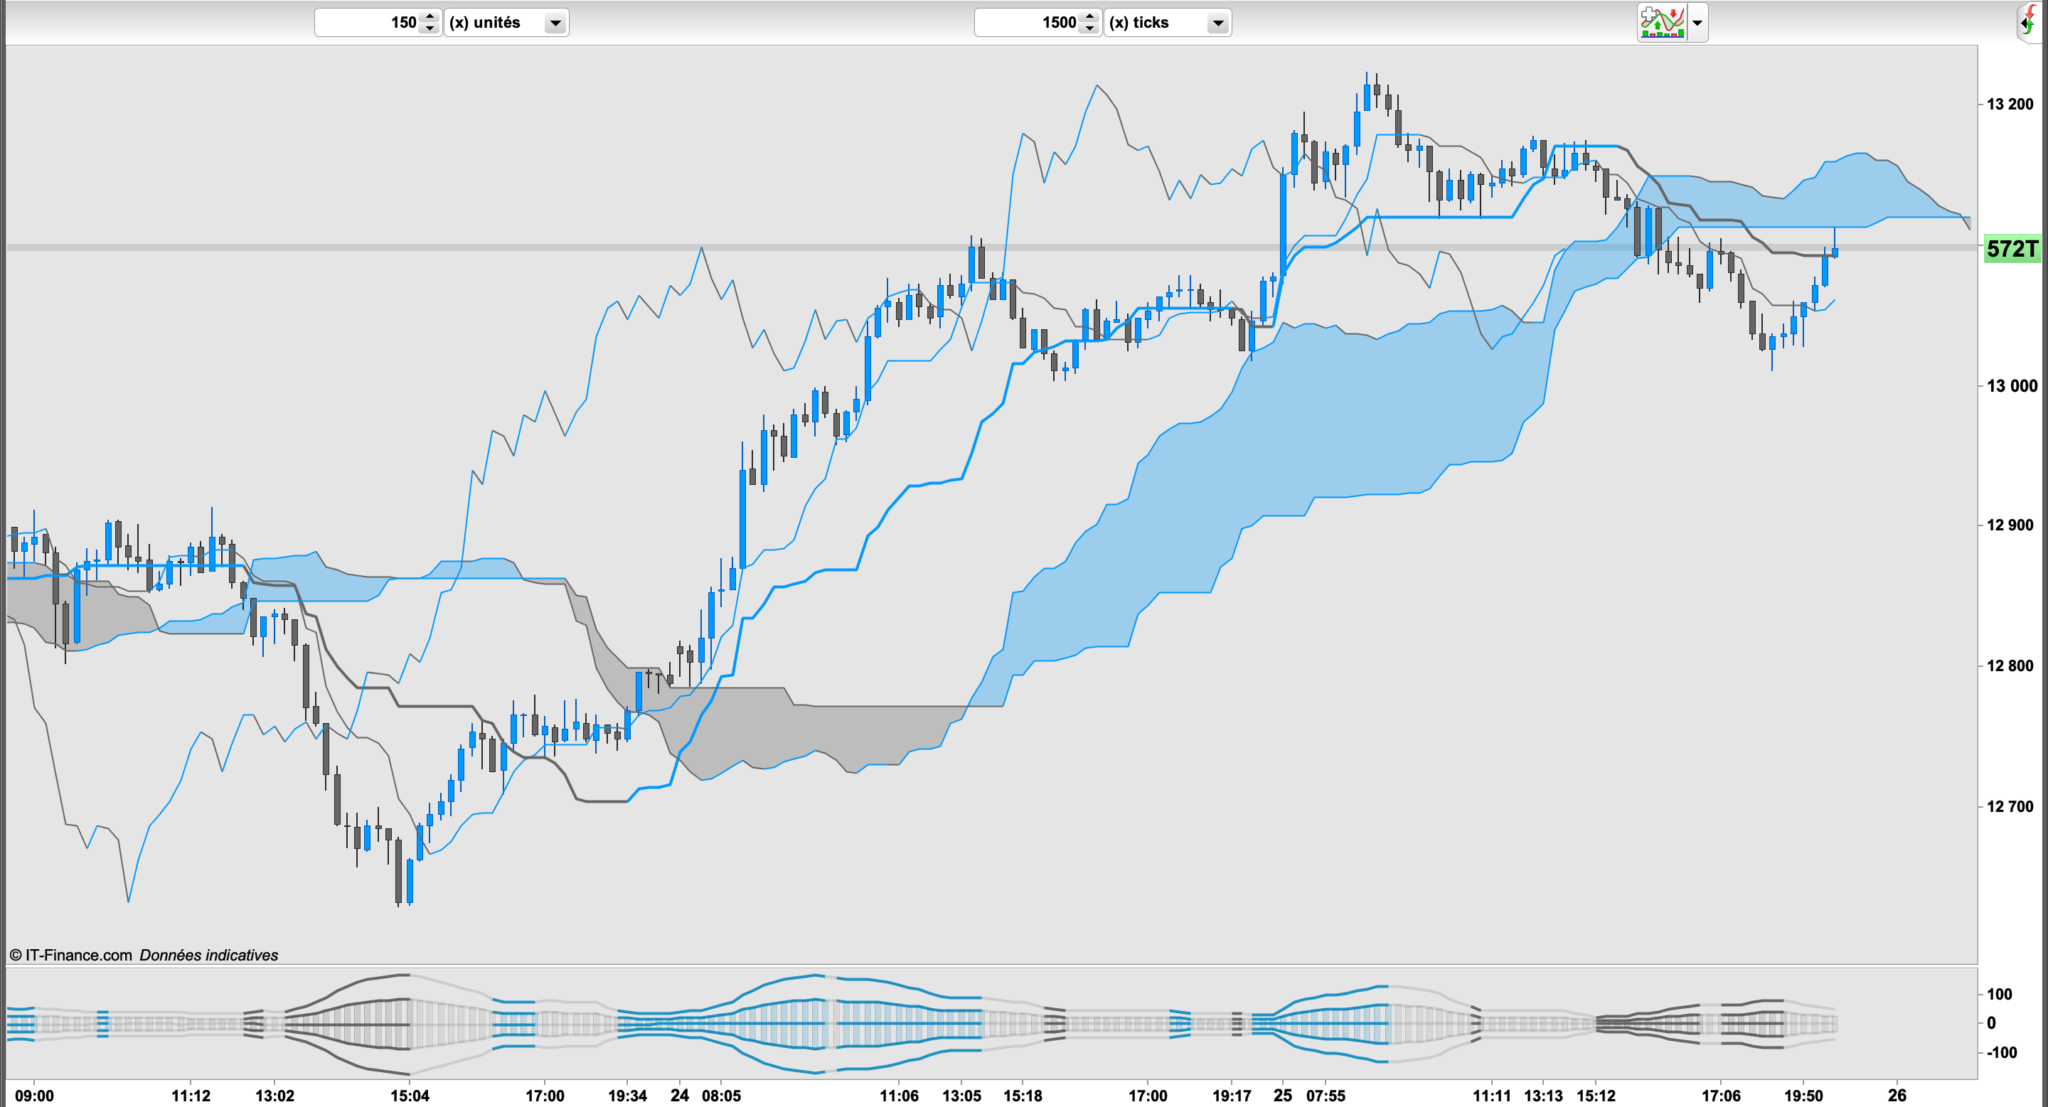
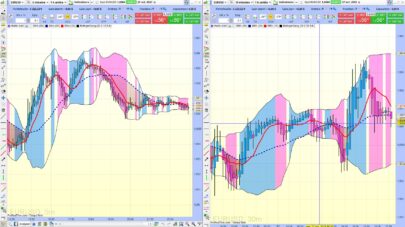
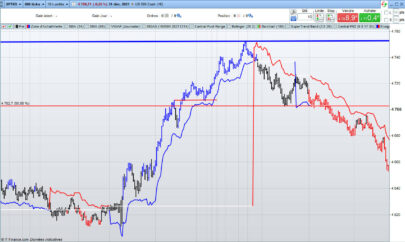
This indicator uses double Bollinger strips.
Also, multiple ADXs are taken into account to measure the strength of the trend, or even its presence.
The objective of this indicator is to give a direction as well as the strength of the trend.
Its use is all the more relevant on a multi-timeframe, so you will take full advantage of its usefulness.
Probably a good idea to avoid being trapped by these ranges.
Kind regards
IV
|
1 2 3 4 5 6 7 8 9 10 11 12 13 14 15 16 17 18 19 20 21 22 23 24 25 26 27 28 29 30 31 32 33 34 35 36 37 38 39 40 41 42 43 44 45 46 47 48 49 50 51 52 53 54 55 56 57 58 59 60 61 62 63 64 65 66 67 68 69 70 71 72 73 74 75 76 77 78 79 80 81 82 83 84 85 86 87 88 89 90 91 92 93 94 95 96 97 98 |
// //============================== Indicateur Trend1 = ADX[5] Trend2 = ADX[10] Trend3 = ADX[15] Trend4 = ADX[20] Trend5 = ADX[25] Trend6 = ADX[30] Trend7 = ADX[35] Trend8 = ADX[40] Trend9 = ADX[45] Trend10 = ADX[50] MM = average[20](close) Bolup = MM+STD[20]*1.0 Boldw = MM-STD[20]*1.0 Bol1 = MM+STD[20]*1.0 Bol2 = MM-STD[20]*1.0 Bol3 = MM+STD[20]*2.0 Bol4 = MM-STD[20]*2.0 CMM1 = Bol1-MM CMM2 = MM-Bol2 CMM3 = Bol3-MM CMM4 = MM-Bol4 MM0 = average[1](close)-(close) MM1 = average[1](MM0)+(CMM1) MM2 = average[1](MM0)-(CMM2) MM3 = average[1](MM0)+(CMM3) MM4 = average[1](MM0)-(CMM4) TrendT1 = Trend1 > Trend1[1] TrendT2 = Trend2 > Trend2[1] TrendT3 = Trend3 > Trend3[1] TrendT4 = Trend4 > Trend4[1] TrendT5 = Trend5 > Trend5[1] TrendT6 = Trend6 > Trend6[1] TrendT7 = Trend7 > Trend7[1] TrendT8 = Trend8 > Trend8[1] TrendT9 = Trend9 > Trend9[1] TrendT10 = Trend10 > Trend10[1] Trend = TrendT1 or TrendT2 or TrendT3 or TrendT4 or TrendT5 or TrendT6 or TrendT7 or TrendT8 or TrendT9 or TrendT10 //============================== Trend Bullsih CA1 = close > MM and close > Bolup and Trend Bullsih = CA1 if Bullsih then A = 1 else A = 0 endif if A = 1 then drawcandle(MM2,MM1,MM2,MM1)coloured(28,144,194,50) R = 28 G = 144 B = 194 T = 250 endif //============================== Trend Bearish CV1 = close < MM and close < Boldw and Trend Bearish = CV1 if Bearish then V = 1 else V = 0 endif if V = 1 then drawcandle(MM1,MM2,MM1,MM2)coloured(100,100,100,50) R = 100 G = 100 B = 100 T = 250 endif //============================== No Trend if A = 0 and V = 0 then drawcandle(MM2,MM1,MM2,MM1)coloured(158,158,158,50) R = 158 G = 158 B = 158 T = 90 endif //============================== Bande Bolliger return MM0 coloured(R,G,B,T) style (line,2) as "Middle", MM1 coloured(R,G,B,T) style (line,2) as "MM1", MM2 coloured(R,G,B,T) style (line,2) as "MM2", MM3 coloured(R,G,B,T) style (line,2) as "MM3", MM4 coloured(R,G,B,T) style (line,2) as "MM4" |
Share this
No information on this site is investment advice or a solicitation to buy or sell any financial instrument. Past performance is not indicative of future results. Trading may expose you to risk of loss greater than your deposits and is only suitable for experienced investors who have sufficient financial means to bear such risk.
ProRealTime ITF files and other attachments :PRC is also on YouTube, subscribe to our channel for exclusive content and tutorials










Bonjour indicateur très intéressant existe t il un screener qui détecte les actions qui donne une direction ainsi que la force de la tendance?
Ce n’est pas le but de cet indicateur, mais avec un peu d’entraînement vous pourriez le coder simplement 😉
Thank you for sharing your good work!