

Trendilo
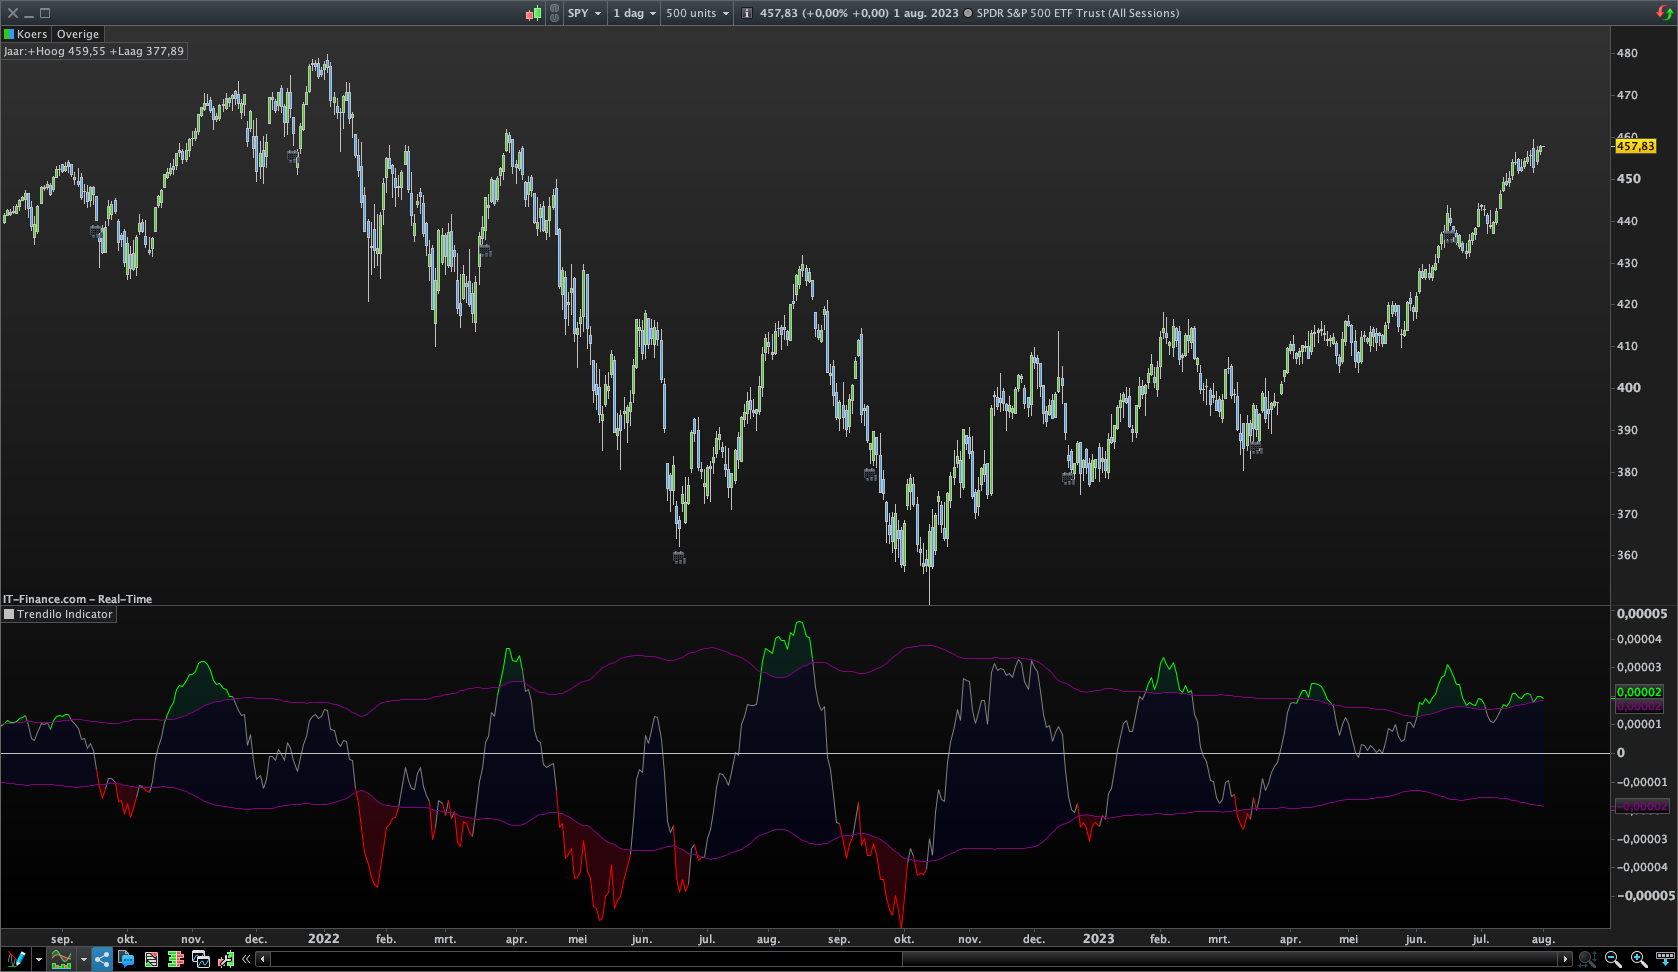
The “Trendilo” helps traders identify trends in price data. The indicator calculates the percentage change of the chosen price source and applies smoothing to it. Then, it calculates the Arnaud Legoux Moving Average (ALMA) of the smoothed percentage change. The ALMA is compared to a root mean square (RMS) band, which represents the expected range of the ALMA values. Based on this comparison, the indicator determines whether the trend is up, down, or sideways. The indicator line is plotted in a color corresponding to the trend direction. The indicator also provides the option to fill the area between the indicator line and the RMS band. Additionally, users can choose to color the bars of the chart based on the trend direction. Overall, the “Trendilo” indicator helps traders visually identify trends and potential reversals in the price data.
(original author: dudeowns)
src=close //Source is Close
smooth=1 //Smoothing (minimum value=1)
length=50 //ALMA Lookbackperiod (minimum value=1)
offset=0.85 //ALMA Offset (step=0.01)
sigma=6 //ALMA Sigma (minimum value=0)
bmult=1.0 //Band Multiplier
blen=20 //Custom Band Length
pch=(src-src[smooth])/(src * 100) //Price change
m = (Offset * (length - 1))
s = length/Sigma
WtdSum = 0
CumWt  = 0
for k = 0 to length - 1 do
Wtd = Exp(-((k-m)*(k-m))/(2*s*s))
WtdSum = WtdSum + Wtd * pch[length - 1 - k]
CumWt = CumWt + Wtd
next
avpch = WtdSum / CumWt
//avpch = ta.alma(pch, length, offset, sigma)
blength = length
rms = bmult * sqrt(summation[blength](avpch * avpch) / blength)
If avpch > rms then
cdir = 1
ElsIf avpch < -rms then
cdir = -1
Else
cdir=0
EndIf
If cdir= 1 then
R=0
G=255
B=0
ElsIf cdir=-1 then
R=255
G=0
B=0
Else
R=128
G=128
B=128
EndIf
DrawHLine(0)
Return avpch as "avpch" Coloured(R,G,B), rms as "rms" Coloured("purple"), -rms as "-rms" Coloured("purple")