







TrendNoTrend Indicator
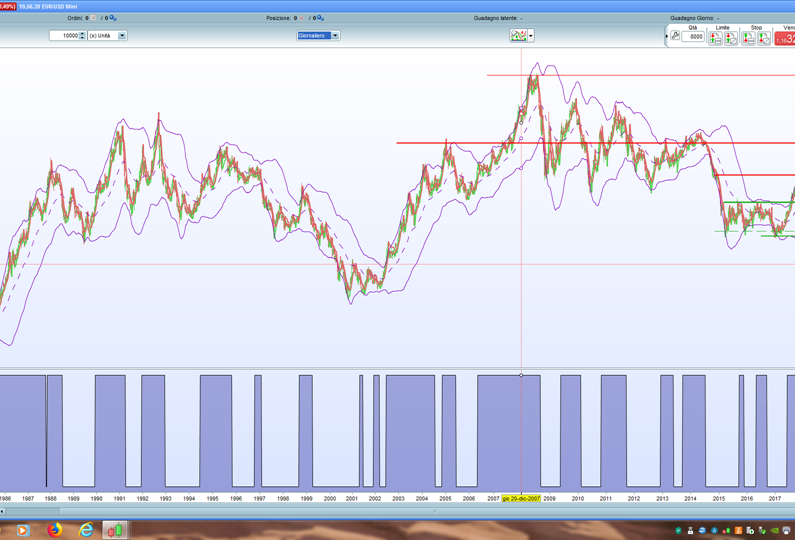
The “Linear regression slope” indicates the direction and intensity of the current trend.
In the abstract hypothesis of total absence of trend the slope of the linear regression is equal to zero: the linear regression is a line parallel to the abscissa axis.
A statistical way of establishing that there is no trend, and so we are in a laterality phase of the market, consists in establishing that the slope of our linear regression is statistically equal to zero in the observation period.
To do this in statistics we use the “t-test”.
For all those who love statistical problems I attach the pdf files with the related explanations.
The statistical formula is translated into the following code.
In a normal distribution, 95% of the data is included in a confidence interval of “Average + – 1.96”.
A “t-distribution” with infinitely many degrees of freedom is a normal distribution.
With an approximation we can state that if t <= 1.96 then our LinearRegressionSlope is equal to zero = there is no trend.
// period da ottimizzare
AA = period
t=(LinearRegressionSlope[AA](close)-0)*SQRT(AA-2)/(STE[AA](close)/STD[AA](Barindex))
if t<1.96 then
 beta=0
else
 beta=1
endif
return beta
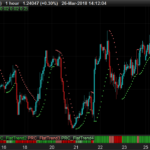
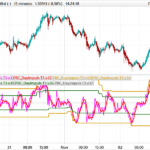
Comments
You must be logged in to post a comment.

Sorry adding the PRT to code didn't work in the above comment so I guess we will have to settle for regular text format... // period da ottimizzare AA = period t=(LinearRegressionSlope[AA](close)-0)*SQRT(AA-2)/(STE[AA](close)/STD[AA](Barindex)) if t>1.96 then beta=1 endif if t<-1.96 then beta=-1 endif if t-1.96 then beta=0 endif return beta

Dear Fulvio09, The concept of calculating trend or no trend attracts me much. First question: the linear regression slope indicator itself gives already the strength of the trend in itself, what does your calculation add to this ? If I compare the graph of the standard linear regression slope indicator with your indicator, and plotting your defined t-values as indicator, (instead of making them 0 or 1), the t-values seems just a multiplication of the linear regression slope values. Therefore my second question: could you explain your formula shortly per item, why it is used , and with a consistent number example ? (For example one of the items STD[AA](Barindex) why is this used ?) Maybe the standard indicator R2 can be used ? Thanks in advance, Jan
I try to answer even if, not being a statistic, it is not easy for me to do it, and even more in these few lines. The "t-test" is used in statistics to compare two groups of data. Basically it compares the difference between the mean of two groups, considering the desperation of the data (expressed as standard deviation). The result “t” of the "t-test" is compared to a table of the values of the "t-test" (see: " https://www.itl.nist.gov/div898/handbook/eda/section3/eda3672.htm " ). In the table for each degree of freedom (first column of the table) you will find next to, the values corresponding to the probability you want to check. If you compare, for example, two groups with 10 data each, the degrees of freedom are 10 + 10 - 2 = 18. If you compare a large number of data (degrees of freedom> 100 to infinity) (last row of the table) you find that for a value of t <1.96 there is a 95% probability that the two groups of data are equal. The "t-test" formula applied to the specific case of "slope of a regression line" can be found at the end of the attached "t-test" pdf file. In essence it compares the difference between the slope of two linear regressions considering the dispersion of data (expressed as "standard error of the slope coefficient"). I suggest you to watch: " https://www.youtube.com/watch?v=j5oPzAJvnVI " you will need to understand why the standard error is also influenced by "STD [AA] (Barindex)".

Something appears to be wrong with this formula as graphing t shows t to almost never be within the -2 to + 2 range. The only reason I believe the author sees extended periods of beta = 0 is due to the fact that he is including bearish linear regression < -1.96 as beta = 0