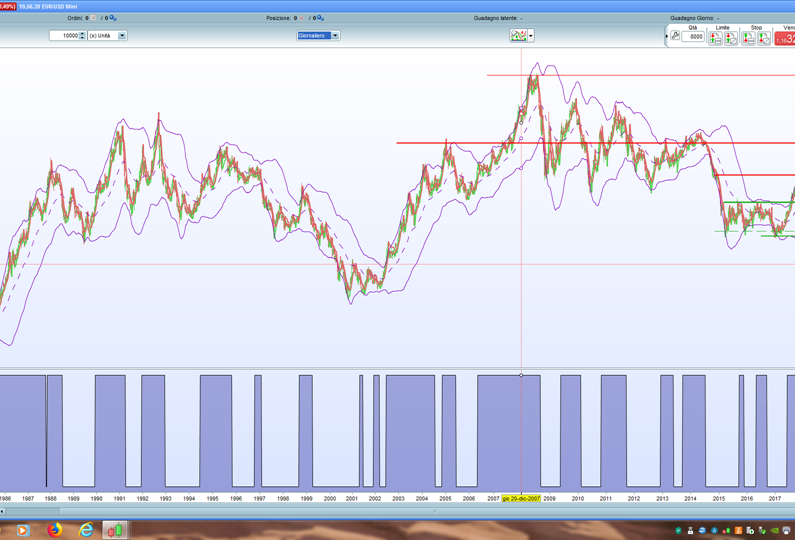
TrendNoTrend Indicator

TrendNoTrend Indicator

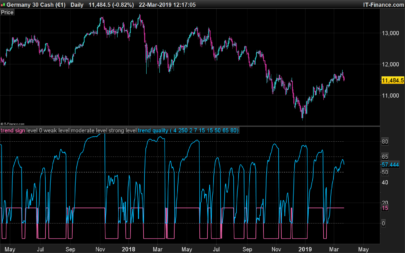
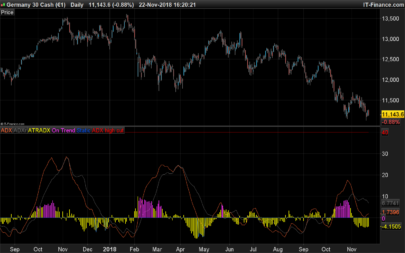
The “Linear regression slope” indicates the direction and intensity of the current trend.
In the abstract hypothesis of total absence of trend the slope of the linear regression is equal to zero: the linear regression is a line parallel to the abscissa axis.
A statistical way of establishing that there is no trend, and so we are in a laterality phase of the market, consists in establishing that the slope of our linear regression is statistically equal to zero in the observation period.
To do this in statistics we use the “t-test”.
For all those who love statistical problems I attach the pdf files with the related explanations.
The statistical formula is translated into the following code.
In a normal distribution, 95% of the data is included in a confidence interval of “Average + – 1.96”.
A “t-distribution” with infinitely many degrees of freedom is a normal distribution.
With an approximation we can state that if    t <= 1.96  then our LinearRegressionSlope is equal to zero = there is no trend.


Share this

Risk disclosure:

No information on this site is investment advice or a solicitation to buy or sell any financial instrument. Past performance is not indicative of future results. Trading may expose you to risk of loss greater than your deposits and is only suitable for experienced investors who have sufficient financial means to bear such risk.

ProRealTime ITF files and other attachments : How to import ITF files into ProRealTime platform?

PRC is also on YouTube, subscribe to our channel for exclusive content and tutorials
  1. Pepsmile • 09/16/2018 #

    Hi FULVI,
    Interesting. But seems to take into account only bull trend.

  2. Jan Wind • 09/16/2018 #

    Dear Fulvio09,

    The concept of calculating trend or no trend attracts me much.

    First question: the linear regression slope indicator itself gives already the strength of the trend in itself, what does your calculation add to this ?

    If I compare the graph of the standard linear regression slope indicator with your indicator, and plotting your defined t-values as indicator, (instead of making them 0 or 1), the t-values seems just a multiplication of the linear regression slope values.
    Therefore my second question: could you explain your formula shortly per item, why it is used , and with a consistent number example ? (For example one of the items STD[AA](Barindex) why is this used ?)
    Maybe the standard indicator R2 can be used ?

    Thanks in advance, Jan

    • FULVIO09 • 09/16/2018 #

      I try to answer even if, not being a statistic, it is not easy for me to do it, and even more in these few lines.
      The “t-test” is used in statistics to compare two groups of data.
      Basically it compares the difference between the mean of two groups, considering the desperation of the data (expressed as standard deviation).
      The result “t” of the “t-test” is compared to a table of the values of the “t-test” (see: ” https://www.itl.nist.gov/div898/handbook/eda/section3/eda3672.htm ” ).
      In the table for each degree of freedom (first column of the table) you will find next to, the values corresponding to the probability you want to check.
      If you compare, for example, two groups with 10 data each, the degrees of freedom are 10 + 10 – 2 = 18.
      If you compare a large number of data (degrees of freedom> 100 to infinity) (last row of the table) you find that for a value of t <1.96 there is a 95% probability that the two groups of data are equal.

      The "t-test" formula applied to the specific case of "slope of a regression line" can be found at the end of the attached "t-test" pdf file.
      In essence it compares the difference between the slope of two linear regressions considering the dispersion of data (expressed as "standard error of the slope coefficient").
      I suggest you to watch: " https://www.youtube.com/watch?v=j5oPzAJvnVI " you will need to understand why the standard error is also influenced by "STD [AA] (Barindex)".

  3. cfta • 09/16/2018 #

    Hi Fulvio, many thanks for sharing this clever indicator, much appreciated. As Pepsmile mentioned it seems that it only accounts for bull trend and ignores bear trend, I modified it in order to include the bear trend. 1 = bull trend, 0 = no trend and -1= bear trend. Enjoy!

  4. cfta • 09/16/2018 #

    Sorry adding the PRT to code didn’t work in the above comment so I guess we will have to settle for regular text format…

    // period da ottimizzare
    AA = period
    t=(LinearRegressionSlope[AA](close)-0)*SQRT(AA-2)/(STE[AA](close)/STD[AA](Barindex))
    if t>1.96 then
    beta=1
    endif

    if t<-1.96 then
    beta=-1
    endif

    if t-1.96 then
    beta=0
    endif

    return beta

  5. juanj • 09/16/2018 #

    Something appears to be wrong with this formula as graphing t shows t to almost never be within the -2 to + 2 range. The only reason I believe the author sees extended periods of beta = 0 is due to the fact that he is including bearish linear regression < -1.96 as beta = 0

avatar
Register or

Likes

avatar avatar avatar avatar avatar avatar avatar avatar avatar
Related users ' posts
Stockastiss Can this code be simply transferred into Backtestingcode so one doesnt need to use call ? (i...
Vonasi Sorry for the late reply. Add the code to your strategy and remove line 5 and line 39. Chang...
viktorthunss Hi! How many averages are there? Can I see the somewhere?
leofi https://www.prorealcode.com/topic/simple-average-with-visual-color/
leofi Go visit www.prorealcode.com/topic/simple-average-with-visual-color/ and watch 2em post
Dritan Hi,I am new on Prorealtime and coding.I downloaded the indi but I have it on a separate wind...
Nicolas Just add it on the price series.
yomisadiku Hello Nicolas, Can I use high and low price at lines hh=max(hh,close) and ll=min(ll,close) ...
Nicolas Yes you can do that, the impact will be that the trailing stop line will be much close to th...
Byggtrader Hi Nicolas! How do I get the indicator in the price chart? It only stays under i new chart.
Nicolas Just add it on the price chart by using the wrench on the left upper side of the chart (pric...
Dom Hello, hello....je commence le trading et découvre par la même occasion le codage....et ce n...
Nicolas Merci, ça fait plaisir !
Be-n Bonjour tout le monde ! Dans l'indicateur de tendance, j'ai du mal à saisir la nuance entre ...
Globalmarkets79 Thank you Vonasi for the answer. I have an other question. When i tried to run the indicator...
Vonasi Lines is either 0 or 1 to turn on or off the drawing of them. Once again if you download and...
Globalmarkets79 Thank you Vonasi, this indicator is very helpful!!!
Nicolas
6 years ago
Bateson Merci pour la réponse Nicolas. C'est bien ce que j'ai fait mais ça ne fonctionne toujours pa...
Enzo Paliotti Veramente ottimo, era quello che cercavo, si potrebbe modificare inserendo come variazione a...
Nicolas Perché no, chiedetelo con una descrizione dettagliata nel forum degli indicatori, per favore!
jiddan78 how to convert to afl amibroker ?
Nicolas We do not supply free coding assistance for AFL Amibroker on the website. You can ask for pa...
Ngomsi @ Vonasi, how to use timeframe , 13 minutes ,21 minutes, 34 minutes,et 55 minutes with this...
manchokcity can we have it in mql4 platform? or how or which platform do we use it?
camporan I don't use MetaTrader so I won't be able to do the translation myself. Sorry!
Alexander9 This can for amibroker ? . Thanks
riz001 thnk u
geroniman bonjour Nicolas, j ai un indicateur le Tiger . J aiemrai placer des fleches buy et sell dire...
Nicolas Merci de formuler les demandes sur le forum. ça n'est pas le bon endroit et hors sujet ici ! ;)
avatar
Anonymous Hi robertogozzi - thank you very much for sharing this strategy. I have performed various ...
robertogozzi Thank you samsampop.
Dotan Hello guys I really appreciate this coding effort but can I use this code for Mt5 Forex Trad...
redactv7 On my charts, the indicator doesnt go on the upper pannel, on prices, but under like an osci...
Nicolas apply in on the chart, look at this how-to video: https://www.prorealcode.com/blog/video-tut...
jonpt88 interesting code thanks!
LucioleLucide Clean view, thanks for sharing
dertopen hi where i can found the window for candle configuration?
paolosab69 Ciao! . I have seen the pictures that explain this metod but i don't understand when is mome...
coscar Ottimo lavoro. come sempre!
luxrun Nello studio di Sepiashvili viene descritto anche un altro indicatore, il Q-indicator, che è...
Jack86gv Ciao Nicolas, e possibile fare uno screener con questo codice ovvero vorrei sapere quando il...
Nicolas https://www.prorealcode.com/topic/screener-regressione-canale/
wharfdog Hi Nicolas, Fantastic work, I'm really grateful for this. I was wondering if it would be ...
darbes Hi How does it go on live ? JC
antonio73 Balmora74, io vedo che funziona anche su timeframe ad 1 minuto con piccole ottimizzazioni, t...
Juananantoniorodriguez hola buenas, a este sistema automático, Cómo se le podría poner un stoploss de beneficio sim...
Maik2404 wie kann ich den Code bekommen Paul?
jens_kittner Works with US Crude at 1h as well!
Jean-Claude REGIS Je préconise de regarder les graphiques H1 et M15 pour visualiser la tendance de fond et d'...
capgros Bonjour @Nicolas, Thanks a lot for this tool, it is very useful for me. I would like to s...
Hans63 Would you add the possibility to color also the Heikin Ashi and bar chart?
Nicolas That's possible, please open a new topic in the indicator forum explaining what you need exa...
Nicolas
6 years ago
BSTrend
v10.3
BSTrend
10
Indicators
Florian Legeard C’est à dire sur le prix et non sur le temps ? Merci
Rohit82189 bstrend repaints
Nicolas No, it doesn't repaint.

Top