TrendNoTrend Indicator

TrendNoTrend Indicator

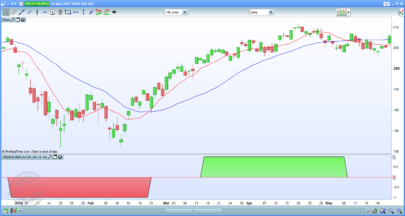
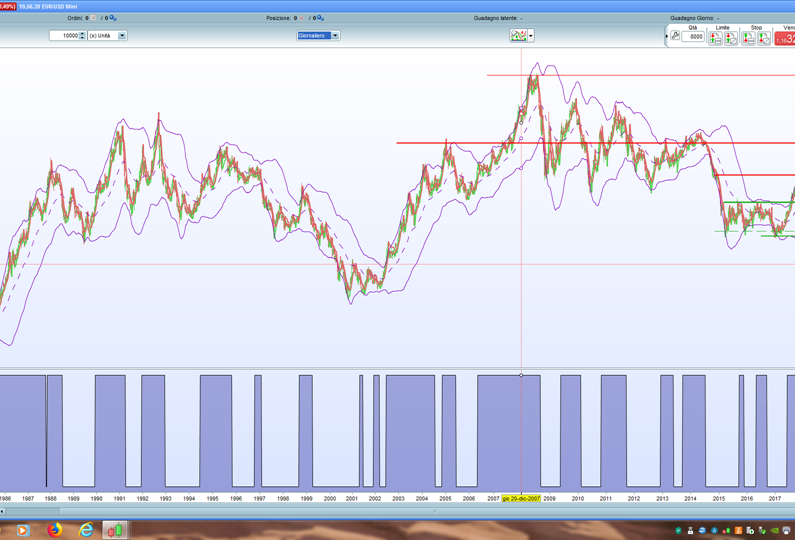
The “Linear regression slope” indicates the direction and intensity of the current trend.
In the abstract hypothesis of total absence of trend the slope of the linear regression is equal to zero: the linear regression is a line parallel to the abscissa axis.
A statistical way of establishing that there is no trend, and so we are in a laterality phase of the market, consists in establishing that the slope of our linear regression is statistically equal to zero in the observation period.
To do this in statistics we use the “t-test”.
For all those who love statistical problems I attach the pdf files with the related explanations.
The statistical formula is translated into the following code.
In a normal distribution, 95% of the data is included in a confidence interval of “Average + – 1.96”.
A “t-distribution” with infinitely many degrees of freedom is a normal distribution.
With an approximation we can state that if    t <= 1.96  then our LinearRegressionSlope is equal to zero = there is no trend.


Share this

Risk disclosure:

No information on this site is investment advice or a solicitation to buy or sell any financial instrument. Past performance is not indicative of future results. Trading may expose you to risk of loss greater than your deposits and is only suitable for experienced investors who have sufficient financial means to bear such risk.

ProRealTime ITF files and other attachments : How to import ITF files into ProRealTime platform?

PRC is also on YouTube, subscribe to our channel for exclusive content and tutorials
  1. Pepsmile • 09/16/2018 #

    Hi FULVI,
    Interesting. But seems to take into account only bull trend.

  2. Jan Wind • 09/16/2018 #

    Dear Fulvio09,

    The concept of calculating trend or no trend attracts me much.

    First question: the linear regression slope indicator itself gives already the strength of the trend in itself, what does your calculation add to this ?

    If I compare the graph of the standard linear regression slope indicator with your indicator, and plotting your defined t-values as indicator, (instead of making them 0 or 1), the t-values seems just a multiplication of the linear regression slope values.
    Therefore my second question: could you explain your formula shortly per item, why it is used , and with a consistent number example ? (For example one of the items STD[AA](Barindex) why is this used ?)
    Maybe the standard indicator R2 can be used ?

    Thanks in advance, Jan

    • FULVIO09 • 09/16/2018 #

      I try to answer even if, not being a statistic, it is not easy for me to do it, and even more in these few lines.
      The “t-test” is used in statistics to compare two groups of data.
      Basically it compares the difference between the mean of two groups, considering the desperation of the data (expressed as standard deviation).
      The result “t” of the “t-test” is compared to a table of the values of the “t-test” (see: ” https://www.itl.nist.gov/div898/handbook/eda/section3/eda3672.htm ” ).
      In the table for each degree of freedom (first column of the table) you will find next to, the values corresponding to the probability you want to check.
      If you compare, for example, two groups with 10 data each, the degrees of freedom are 10 + 10 – 2 = 18.
      If you compare a large number of data (degrees of freedom> 100 to infinity) (last row of the table) you find that for a value of t <1.96 there is a 95% probability that the two groups of data are equal.

      The "t-test" formula applied to the specific case of "slope of a regression line" can be found at the end of the attached "t-test" pdf file.
      In essence it compares the difference between the slope of two linear regressions considering the dispersion of data (expressed as "standard error of the slope coefficient").
      I suggest you to watch: " https://www.youtube.com/watch?v=j5oPzAJvnVI " you will need to understand why the standard error is also influenced by "STD [AA] (Barindex)".

  3. cfta • 09/16/2018 #

    Hi Fulvio, many thanks for sharing this clever indicator, much appreciated. As Pepsmile mentioned it seems that it only accounts for bull trend and ignores bear trend, I modified it in order to include the bear trend. 1 = bull trend, 0 = no trend and -1= bear trend. Enjoy!

  4. cfta • 09/16/2018 #

    Sorry adding the PRT to code didn’t work in the above comment so I guess we will have to settle for regular text format…

    // period da ottimizzare
    AA = period
    t=(LinearRegressionSlope[AA](close)-0)*SQRT(AA-2)/(STE[AA](close)/STD[AA](Barindex))
    if t>1.96 then
    beta=1
    endif

    if t<-1.96 then
    beta=-1
    endif

    if t-1.96 then
    beta=0
    endif

    return beta

  5. juanj • 09/16/2018 #

    Something appears to be wrong with this formula as graphing t shows t to almost never be within the -2 to + 2 range. The only reason I believe the author sees extended periods of beta = 0 is due to the fact that he is including bearish linear regression < -1.96 as beta = 0

avatar
Register or

Likes

avatar avatar avatar avatar avatar avatar avatar avatar avatar
Related users ' posts
Doctrading AH ok, I think the ca3 is the same : ca3 = pB[1] < 0.2 and pB < 0.2 Best regards,
chromosome21 Hello everybody, First, thank you so much for all your advices, I'm a begginer in trading a...
bertrandpinoy bonjour j ai un probleme avec ce code modifié, apparement PRT ne veut pas...avez vous une so...
rispardin no entiendo como funciana este indicador, por favor alguien podria explicar como utilizarlo???
AVT No se trata de un solo indicador, pero cada linea muestra otra información, de abajo hacia ...
IV Mcm Your indicator is interesting, I evaluated its relevance with the squeeze to detect the phas...
Kris75 Hi Gabri I launched a very simple strategy based on the 3 bars trailing stop that you cre...
TimDeCat Hi. Has anyone coded a version that you could alter it to say 5 bar trailing stop? ie make ...
Nicolas Please open a new topic in forums so we can code it there, thanks.
finplus bonjour, il y a un problème à la fin du code avec elsif (close 0 then ... ne manque t il pas...
kj1988 Hello Nicolas, thank you for this useful indicator. Could you tell me how I can remove the...
Nicolas remove lines 101 to 103
GraHal Yes sorry, I set up a link to a screen shot on my google drive and then I got locked into th...
gabri Here's the thread https://www.prorealcode.com/topic/multiframe-rsi-of-rsi/
Bernard13 Bonjour Nicolas, Pourriez-vous m'indiquer si cet indicateur fonctionne avec la V11 ? Le di...
KarlBenjamin This "indicator" alone has completely changed my algorithms for the better! Id even go as fa...
ashee CAN YOU SHARE MT4 FILE
coyP Big thanks ! Can you explain me how can I put this ON my graph and not under the graph please ?
HeikinAshi Do you have an update of this indicator since you've created them, or is this still the actu...
mcha Thank you for this work. Do you try to transform/put this indicator on candlesticks and is ...
Nicolas We do not offer free assistance for TOS. However, you can send demand for private paid codin...
phanz Hi community. May I know how you use this indicator please? Is it on the zero cross over? ...
sydney43025 Hello, I'm digging up this topic because I uploaded the code on a PRT v11.1 but the indicato...
David Balance thanks for sharing this excellent indicator.  Here are some thoughts.  please ad...
reb Hello Marc your strat seems very intersting, will take a look Reb
897148 What exactly is meant by Total price? Is r1 =28 in your example the no of days for "Total P...
otty82  THX looks good!
century nice one , thank you
arvindrao01 Hey! Does anyone have a pinescript (tradingview) code for this?
imokdesign Hi Everybody, when I look at the strategy I felt the need to implement a Moneymanagement-Sy...
Inertia newlevel then multiplier=multiplier+1 oldlevel=newlevel newlevel=strategyprofit+startequi...
Inertia Hi Bjoern, I was playing around with your code this morning (EUR/USD 5'). Thank you to the...
CavalierDeCesDames Bonjour Nicolas, Thanks for your use full job. I tried this indicator on a shorter timefram...
Nicolas You are welcome. I'm glad you like it.
Bolbo It does not appear over the price indicator on V11. Thanks in advance.
Maxime Baudin Nice, thanks!
rowestock Hi Nicolas, I am revisiting this indicator and wanted to ask, is it possible to replace sty...
Nicolas Why not, please add a new request in our probuilder forums.
bearbull As per PhilipSchultz question above, has anybody managed to add code for when it turns blue,...
Ybr35 Bonjour Nicolas, lorsque je lance l'indicateur, il m'est indiqué que je dois définir les var...
Nicolas L'idéal est de télécharger le fichier itf joint sur cette page et de l'importer dans la plat...
Nicolas Merci dans ce cas d'ouvrir un sujet dans le forum ProScreener svp.
Andrea Hi Nicolas, thx for your code. Please i need your help to understand this part of your code:...
Nicolas the MA200 is ascending since 20 periods.
Regan2020 Hi, has anybody update the above code to enable on a 15m or 5m TF?
gigi64 ik heb de code op mijn pro realtime gezet , en bij indicator staat hij erbij maar komt niet ...
gigi64 I have put the code on my pro realtime, and it is on the indicator, but it does not appear o...
supertiti Thanks you so much Lucassen
dreif123 hi, copied the above code, not working on 10.3 the system says "return can only be used at ...
LUCASSEN Hallo , i have no problem , and i have the same versie 10.3, maybe you can ask Nicolas, tha...
Krallenmann Hallo Nicolas, kannst du mir die Regeln für den Halftrend Indikator sagen? Aus dem Code kann...
davefransman Dear Nicolas, i want set a alert on the "HalfTrend "custom moving average" met Heikin Ashi w...
Nicolas Please post the question in a new forum topic, that would need custom coding I believe.

Top