Triple Function Indicator

Triple Function Indicator

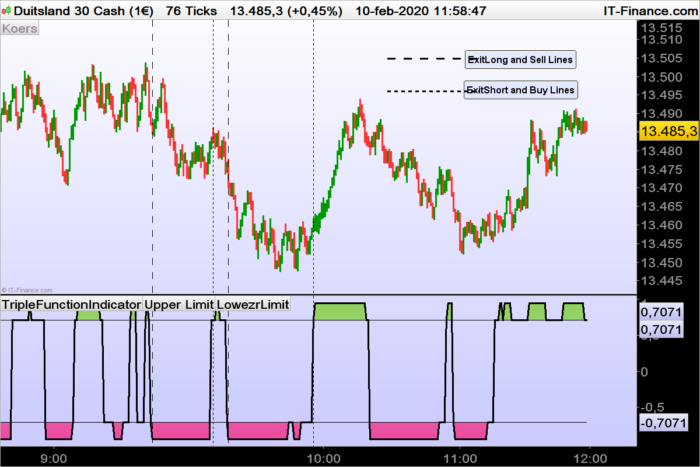
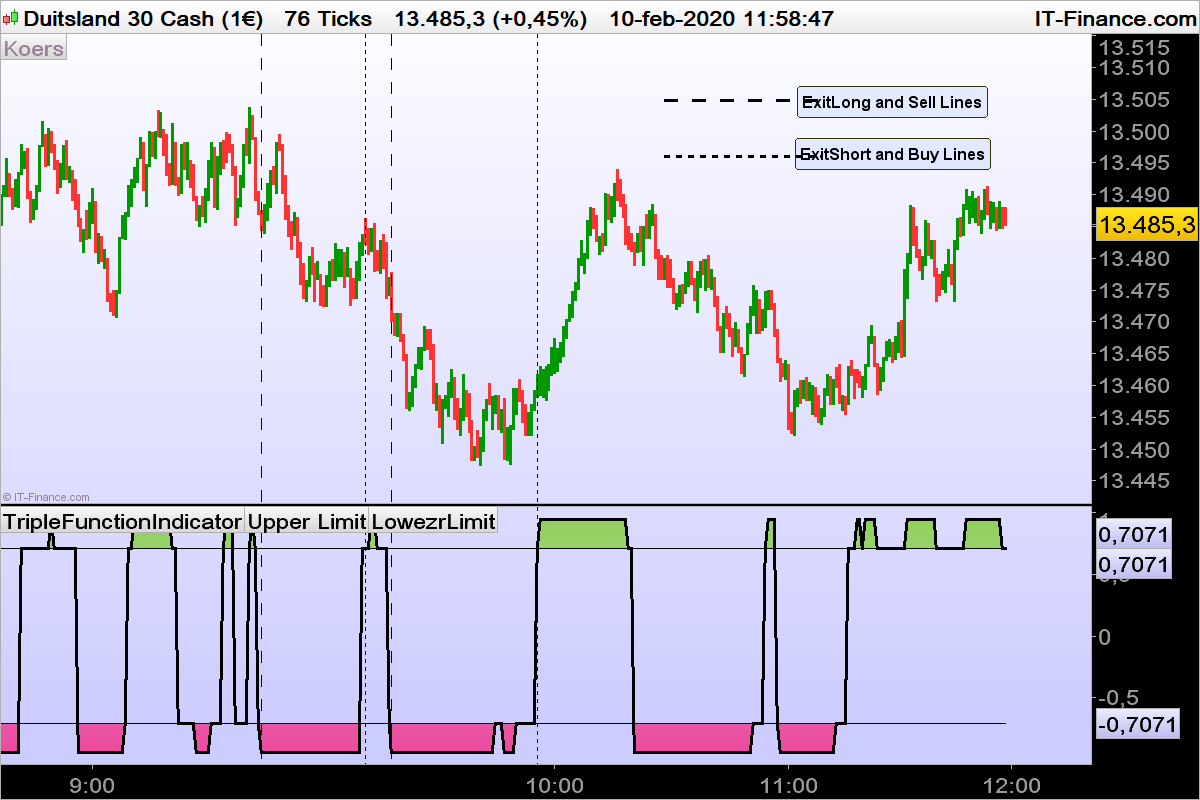
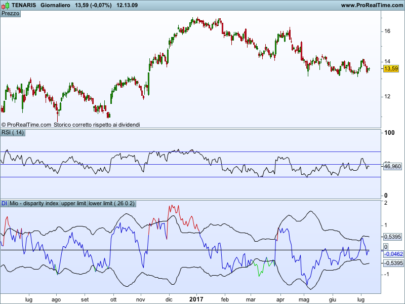
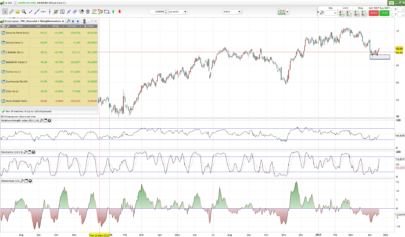
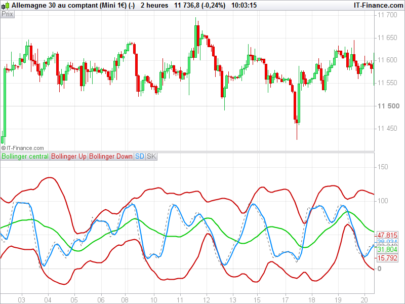
TripleFunctionIndicator (TFI) is meant to be a daytrading system that give good results on a 10 minutes graphic. Especially its a combination of three 3 Indicators namely the SMI The CCI and the RSI indicator. As you can see on the graphic,, even on an overbought situation, given by DemarkIndicator  it do work. The classic limits for each indicator are repected.

For SMI  +40 and -40

For CCI  +100 and -100

For RSI  70 and 30.

Finally each Indicator give 3 results if there is a condition fullfilled or not and none of the two.

The total result is calculated and as only 3 possibilities  namely +3 ;+1 ; -1 and -3.

Share this

Risk disclosure:

No information on this site is investment advice or a solicitation to buy or sell any financial instrument. Past performance is not indicative of future results. Trading may expose you to risk of loss greater than your deposits and is only suitable for experienced investors who have sufficient financial means to bear such risk.

ProRealTime ITF files and other attachments : How to import ITF files into ProRealTime platform?

PRC is also on YouTube, subscribe to our channel for exclusive content and tutorials

  1. Souhail Sam • 02/05/2020 #

    I need help to understand this.
    When to buy ? When to sell ?
    How this indicator must look like ?
    Once I make your code with the indicators i only have lines that i can’t understand.
    Thank you for Sharing and for help

    • Zigo • 02/05/2020 #

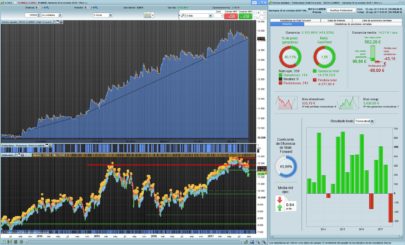
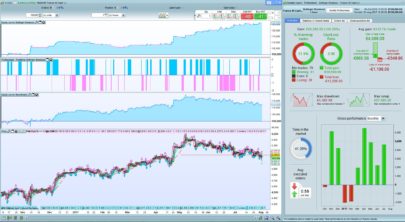
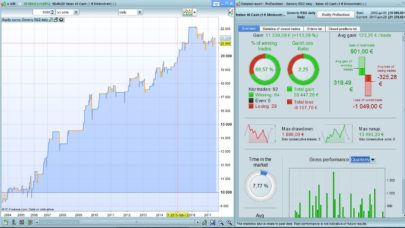
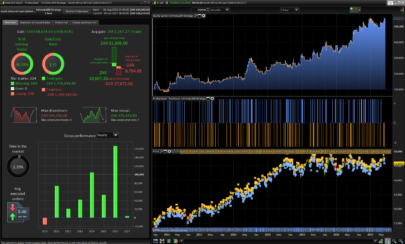
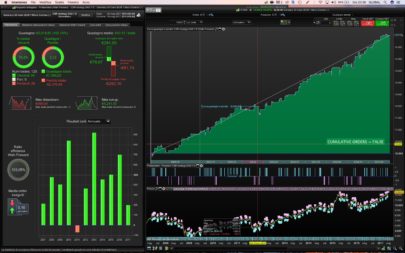
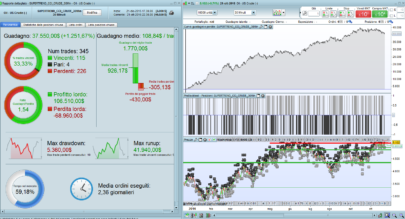
      I can understand that it is a little bit confused. Therefore some more explanation: The Indicator is correct (for values 17 for n and 5 for m ) but I have posted the backtest results instead of the indicator vieuw.(sorry)
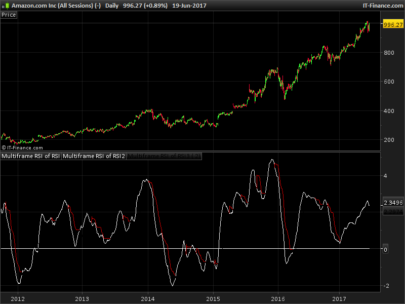
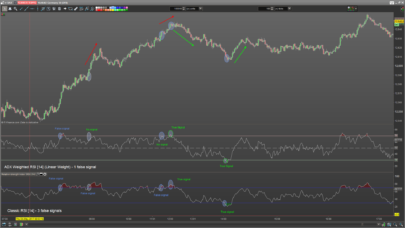
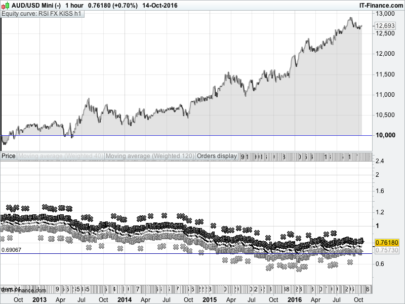
      I shall try to post a graphic, that will explaine a lot.
      In fact TFI is an indicator concist of tree classical indicators, who are testest all three. The result is “Yes” or “No” “Yes” equals (+1 ) No” equals (-1) If all three the indicators are “Yes” , we are in a bull fase and contrairely 3 times “No” is a bearish result.
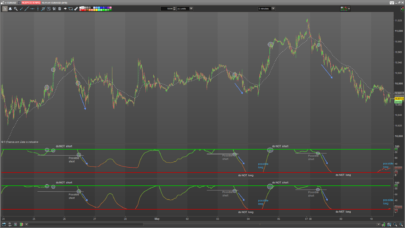
      If you take the sine of the arctangent of the result, then the results are:
      Yes,Yes,Yes (+3)
      Yes, No Yes (+1) also :(No, Yes, Yes (+1) and Yes, Yes, No(+1) )
      No,No,No (-3)
      Yes,No,No (-1) and so on
      For the sin(atan( Value) there are only for results:
      1) Strong Trend +3 (0.94868)
      2)Strong Trend -3 (-0.94868)
      3) Minor trend +1 and -1 (0.70711 and -0.70711 resp.)
      Thats it. For the rest is watch and see.

  2. Balmora74 • 02/05/2020 #

    thanks very interesting 🙂

  3. Wolf • 02/05/2020 #

    Compilation by sinusoid concept is very interesting. Thanks

  4. groen200 • 02/05/2020 #

    Hi Zigo can you make backtest from this indicator

  5. rosario • 02/05/2020 #

    Good evening I would like to understand why it doesn’t work for me.
    Rosary

  6. xar3 • 02/05/2020 #

    Hello,
    I would like to comment that observing the logic of the variables of the three indicators, it is likely that in line 5 the result of the SMI variable should be <-40

    Perhaps it would also be logical to give a value "0" to ZLS1, ZLS2, ZLS3, when the value of the three indicators is not in the margins defined for +1 or -1

  7. fifi743 • 02/05/2020 #

    Good morning,
    there is no mistake about the shorts
    c11=SMI[14,3,5](close)>-40

    • Zigo • 02/05/2020 #

      has to be c11=SMI[14,3,5] < -40
      (indeed)

    • xar3 • 02/05/2020 #

      Thank you 😉 Zigo

avatar
Register or

Likes

avatar avatar avatar avatar avatar avatar avatar avatar avatar avatar avatar avatar avatar avatar avatar
Related users ' posts
rejo007 hello david, i'll try it could you tell me wich strategy do you use in real? thanks
David Somogyi Hello, I have a couple of DAX strategies of breakout and mean reversion. I'll try to post...
Roberto Blázquez Hi David, I just saw your strategy and it's good!!! I'm going to try it from today in real a...
juanj To follow new developments or get the latest version of this strategy please visit the forum...
tahar Hello Juan, I wanted to test Universal Strategy via a demo account on PRT but nothing happen...
BravoDelta @juanj wondering if you may help me please. I am looking for a simply strategy to use on the...
Wilko I am not familiar with the screener function, but I am quite certain it should be quite simp...
Gubben @Wilko have you had a look at this again since MTF support? Heard you talk on Börssnack btw..
Wilko @Gubben not really. It was something I posted to show that simpler is usually better. Hope y...
GraHal Yes sorry, I set up a link to a screen shot on my google drive and then I got locked into th...
gabri Here's the thread https://www.prorealcode.com/topic/multiframe-rsi-of-rsi/
Bernard13 Bonjour Nicolas, Pourriez-vous m'indiquer si cet indicateur fonctionne avec la V11 ? Le di...
nwesterhuijs Thanks, only saw it just now.
juanj For the latest version and discussions see the Ichimoku thread here: https://www.prorealcod...
Louwrens Hi Juanj. Thanks for this. I am tying it as we speak. It does not trade that often, which is...
ALE
8 years ago
CSR strategy DAX 1 D
17
Strategies
Jesper I tried it on dax 1D and I did not get any trades. Shifted to 10H and it started working. Wo...
rgrgrgr I have the same problem
avatar
crazytrader Is this working?
Maz
8 years ago
Francesco78 very nice, thanks!
Wilko Interesting! Thanks for sharing!
BjornH Extremely nice, thanks!
finplus Thanks for the job. Which variables do you suggest for timeframe 1 hour? 
Maz Depends massively on your market and the volatility. I suggest using the variable optimizer ...
1Randy This a great momentum filter! I would like to see volume momentum incorporated into the indi...
Nicolas All conditions under parenthesis for the c1 to c4 conditions should be inverted. 
tomus Can you give an example of the overbought codes please? Thanks.
ams123 Frank Merci Nicholas -:)
Djo Not working on V11. The RSI doesn't appear on the chart.
Mika83 Bonjour, J'ai des soucis de lecture de syntaxe avec la variable "drawsegment" sur la versio...
seb234 Salut Mika, j'ai la version V11.1, la formule fonctionne. Mais il est préférable, dixit Nico...
bolsatonimora2 Hi, nice indicator, it´s possible to include a middle line with 50 value? ty!
gabri Hi, EMA26 approximate almost exactly the 50% line
Alain Wilder MA is exactly the 50% line
owes29 Hi is there anyway to develop this for the pro scanner on daily or hourly scans. so it woul...
Nicolas Of course, please add a query in the proscreener forum.
Bruno Carnazzi C'est dommage, cette histoire d'énergie fractale bousille complètement la précision de l'ind...
gregus bonjour a tous quelqu un pourait il recodé en prt il sagit  du dynamique zone ma, je n arri...
Nicolas Merci de faire une requête spécifique sur le forum. 
Nicolas
8 years ago
StepRSI
StepRSI
5
Indicators
Nicolas Thanks for this modification, I still do not have tested it, where did you get this idea to ...
rfsteve Trial and error from study of indicators call it coding mad science was trying to find an in...
Maxime Baudin Nice! Thanks :)
Nicolas
8 years ago
GraHal Forked code I mention above is here ... GraHal wrote: So below is the PRC Stochastic RSI v...
GraHal Try again (quite limited what you can do as Comments in the Library) https://www.prorealco...
AutoFlanders Thanks GraHal, that's what i was looking for
DANY I did it on demo account; it's too dangerous for mea and I can not resist psychologically  ....
demoz How can a demo account be dangerous? Did you have it run live (on a demo account for exampl...
DANY Yes, I mean that I tried on a demo account for 2 months and it had work fine, like the BackT...
Dimi.A Awesome mate.
mora87 Hi David and Nicola, I'd like to share idea with you guys which is related to David's Idea. ...
Nicolas Please ask for custom coding in forums instead.

Top