







TTM Squeeze Pro
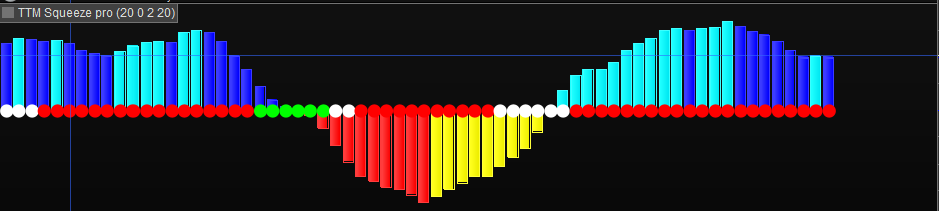
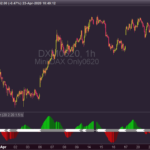
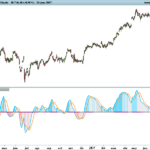
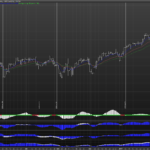
Hi guys, please find here the TTM squeeze pro. This updated version of the TTM squeeze now includes 3 levels of squeeze, low, mid and high compression rather than the previous mid squeeze only. It also includes the momentum histogram. Thanks to JS who helped with parts of the code.
length=20
lengthkc=20
mult=2.0

DonchianMidline = (Highest[20](high)+Lowest[20](low)+Average[20](close) )/3
sma=close-(DonchianMidline)
Delta = linearregression[20](sma)
basis = exponentialaverage[length](close)
dev = mult * Std[length](close)
BBup = basis + dev
BBdn = basis - dev

//KC
ma = exponentialaverage[lengthkc](close)
myrange = averagetruerange[14]
KC2up = ma+myrange * 2
KC2dn = ma-myrange * 2
KC15up = ma+myrange * 1.5
KC15dn = ma-myrange * 1.5
KC1up = ma+myrange * 1
KC1dn = ma-myrange * 1
sqzOnlow = (bbup<kc2up) and (bbup>kc15up) and (bbdn>kc2dn) and (bbdn<kc15dn)
sqzOnmid = (bbup<kc15up) and (bbup>kc1up) and (bbdn>kc15dn) and (bbdn<kc1dn)
sqzOnhigh = (bbup<kc1up) and (bbdn>kc1dn)
if sqzOnlow then
DrawPoint(BarIndex,0,3)Coloured(255,255,255)
//AcolorR = 255
//AcolorG = 255
//AcolorB= 255
else
//DrawPoint(BarIndex,0,3)Coloured(255,0,0)
//colorR = 255
//colorG = 0
//COLORB=0
endif

if sqzOnmid then
DrawPoint(BarIndex,0,3)Coloured(0,255,0)
//BcolorR = 0
//BcolorG = 255
//BcolorB= 0
else
//DrawPoint(BarIndex,0,3)Coloured(255,0,0)
//colorR = 255
//colorG = 0
//COLORB=0
ENDIF
if sqzOnhigh then
DrawPoint(BarIndex,0,3)Coloured(0,0,255)
//CcolorR = 0
//CcolorG = 0
//CcolorB= 255
else
//DrawPoint(BarIndex,0,3)Coloured(255,0,0)
//colorR = 255
//colorG = 0
//COLORB=0
ENDIF
If BBUP > KC2UP AND BBDN<KC2DN then
DrawPoint(BarIndex,0,3)Coloured("Red")
EndIf

//histogram modifications
if delta>0 and delta>delta[1] then
plusI = delta
plusD = 0
minusI = 0
minusD = 0
colorR=0
colorG=245
colorB=255
elsif delta>0 and delta<delta[1] then
plusI = 0
plusD = delta
minusI = 0
minusD = 0
colorR=0
colorG=0
colorB=255
elsif delta<0 and delta<delta[1] then
plusI = 0
plusD = 0
minusI = 0
minusD = delta
colorR=255
colorG=0
colorB=0
elsif delta<0 and delta>delta[1] then
plusI = 0
plusD = 0
minusI = delta
minusD = 0
colorR=255
colorG=255
colorB=0
endif


RETURN plusI coloured(colorR,colorG,colorB) style(histogram,1) as "plus increase", plusD coloured(colorR,colorG,colorB) style(histogram,1) as "plus decrease", minusI coloured(colorR,colorG,colorB) style(histogram,1) as "minus increase", minusD coloured(colorR,colorG,colorB) style(histogram,1) as "minus decrease"
Enjoy!
Comments
You must be logged in to post a comment.
No, the dots only show the compression of the volatility. There are 3 levels of "squeeze" when volatility is narrowing, the white dots show the widest squeeze, the green dots show the medium compression and the blue dots the highest compression. The idea is that when volatility compresses to form a squeeze you often get an explosive breakout. To see the direction of the breakout you can use the histogram which is a linear regression of momentum. There is loads of information on the "squeeze pro" indicator on you tube if you would like to learn more about how people use it. John Carter is the creator and he has done many videos on this indicator. Best regards



I dont speak French but i think i understand the question. The indicator is used for volatility breakouts, the dots show when a stock/market is in a "squeeze" which means that volatility has reduced. The low squeeze is when the Bollinger bands are inside the 2 ATR Keltner channels, the mid squeeze is when the Bands are within the 1.5 ATR Keltners and the high squeeze is when the Bollingers are inside the 1 ATR Keltners. The indicator can be used in any time frame. 2
Hi Alfy, I'm trying to understand your indicator, so I made the Bollinger Bands and the Keltner Channels visivle in my price charts. Do both the upper and lower BB be within the Keltner channel, or is 1 good enough? What are your setting from the KC? 2 standard deviations or 1? But if I only want to use your indicator, what's the best way to trade with it? When red dots, "go with the flow"? So if the candle are below 0, you can stay short, when above, stay long? When dots are white, you can expect a bigger move to come (because BB are within KC). Of course a trader wants to catch a big move instead of sideways action, what is the best set-up? In other words: what's the colour of the dot I have to look for? And if the histogram is below 0, direction of the move should be down, and when above 0 up? Thanks in advance! Greeting, Ted