Hello,
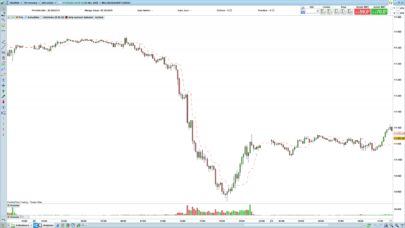
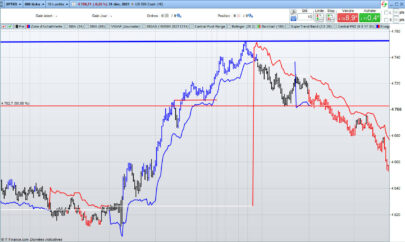
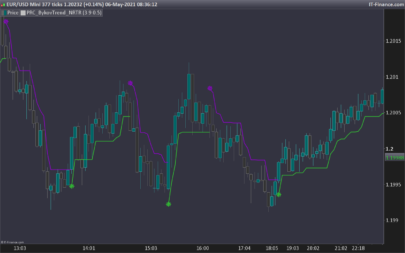
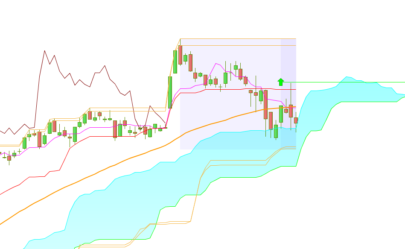
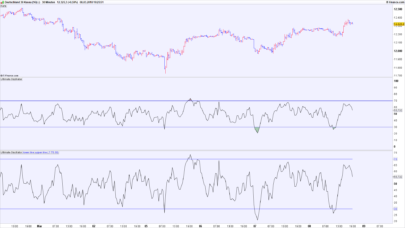
Here is a particularly interesting indicator.
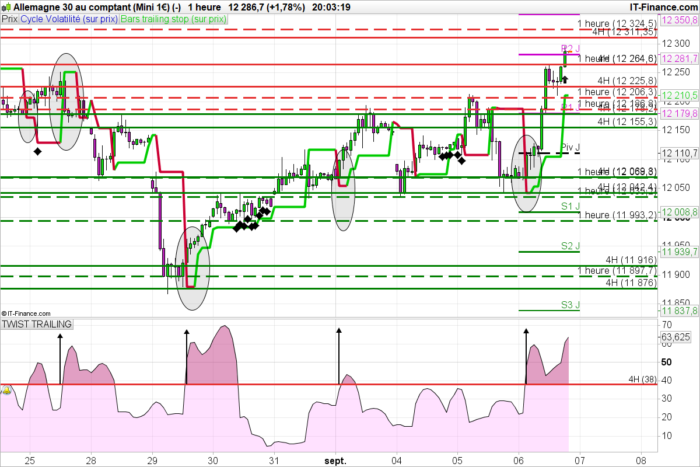
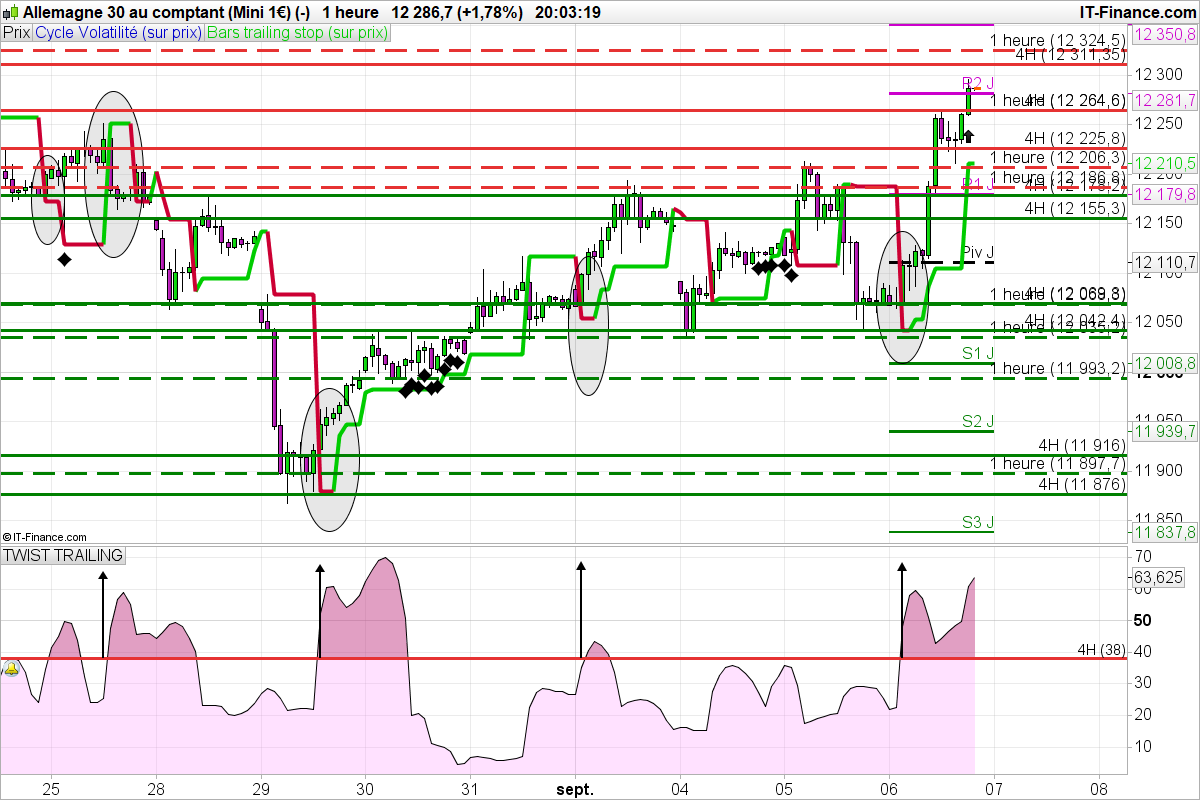
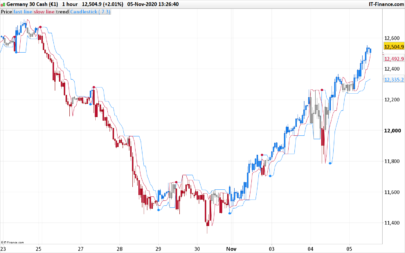
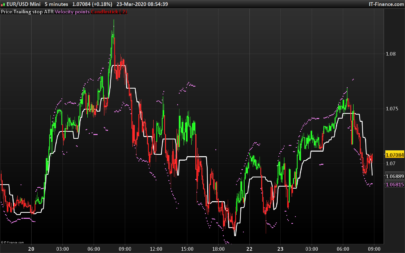
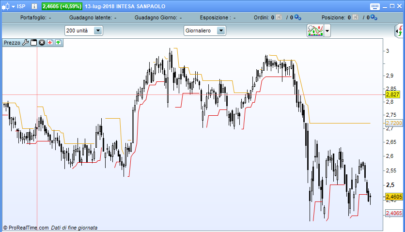
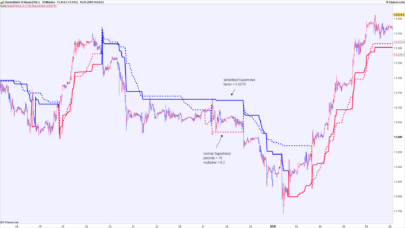
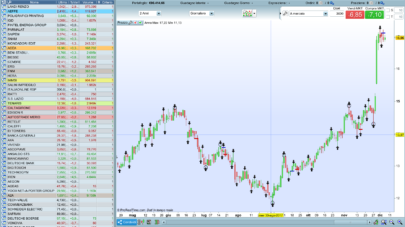
Based on the STE and 3 ‘BARS TRAILING STOP by larry WILLIAMS.
I was trying to anticipate the changes of direction and the idea came to associate the two. The result is quite edifying. I work with the indicator of larry williams in 5MN since a long time, but this one was not clear enough for the big trends.
Thanks to this new indicator in 1 hour, I take better positions at the start of the trend.
Period = 15
Positioning = TWIST> 38 and in the direction of the trailing stop.
Tracking Position in Timeframe 5MN and Reinforcement on Pullback.
Good trades
|
1 2 3 4 5 6 7 8 9 10 11 12 13 14 15 16 17 18 19 20 21 22 23 24 25 26 27 28 |
nbrperiode = 15 count=1 i=0 j=i+1 tot=0 while count<4 do tot=tot+1 if (low[j]>=low[i]) and (high[j]<=high[i]) then //inside bar j=j+1 else count=count+1 i=i+1 J=i+1 endif wend basso=lowest[tot](low) alto=highest[tot](high) if close>alto[1] then ref=basso endif if close<basso[1] then ref=alto endif twist = ste[nbrperiode](ref) return twist |
Share this
No information on this site is investment advice or a solicitation to buy or sell any financial instrument. Past performance is not indicative of future results. Trading may expose you to risk of loss greater than your deposits and is only suitable for experienced investors who have sufficient financial means to bear such risk.
ProRealTime ITF files and other attachments :PRC is also on YouTube, subscribe to our channel for exclusive content and tutorials



This looks very interesting. What is the criteria behind the timeframe and period you choose? Do you think it would be possible to have an upside-down version for short positions?
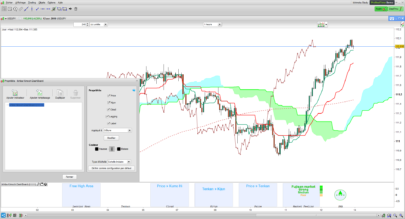
l’indicateur fonctionne pour les positions short ou long.(cf graphique).il nous indique uniquement que passer les 38 points il va se passer quelques choses.Soit une continuation de tendance soit une inversion.Le timeframe est de 1H et la période du ste et de 15 bars ce qui est le plus pertinent en testing .Une fois les 38 points passés l’indicateur 3 bars trailing stop me donne la direction.
Bonjour, j’ai quelques questions concernant cette combinaison d’indicateurs qui à l’air intéressante, 1°/ qu’est que le STE 15 bars, je n’arrive pas à trouver à quoi cela correspond, ni sur le graphique, ni en le cherchant dans les indicateurs – 2°/ Est ce que le twist est une confirmation du trailing stop ou bien une annonce du changement vu sa position ? Merci beaucoup JOLI BOULOT
Merci beaucoup
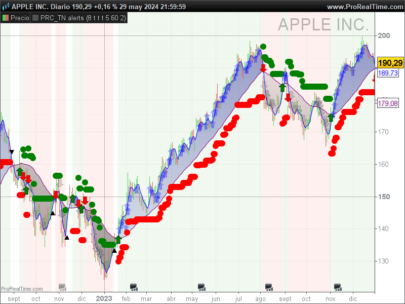
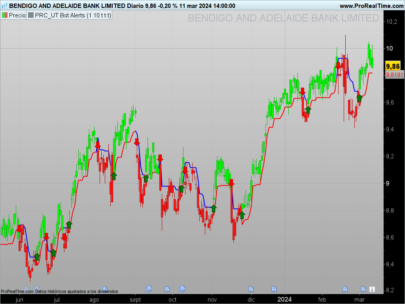
But what I’ve noticed is that it gives you very good indications for Long positions but exiting them or opening Short is a bit trickier. I just wonder if there is any part of the code which could help you with shorts.
STE : Fonction statistique “erreur standard” de séries temporelles de N périodes pour le prix sélectionné. Syntaxe: STE [N] (prix) Interprétation: Cet indicateur nous permet de savoir si les prix sont proches de la ligne de régression linéaire ou non. Plus ils sont proches, plus la tendance est fiable. D’autre part, plus ils sont moins fiables, c’est la tendance. Cet indicateur est souvent utilisé par rapport à R² de manière à interpréter les inversions de tendance .Indicateur disponible dans les indicateurs.
Le twist est un possible changement de tendance confirmé par le trailing stop
Merci pour ces informations précieuses larouedegann. J’y vois plus clair. Encore joli boulot