1. Introduction
The Ultra Trend is an indicator designed to identify and follow the prevailing market trend, helping traders to leverage trends in a clear and efficient way. This indicator combines various advanced calculations, such as smoothing filters and directional price analysis, enabling it to detect trend shifts in market movements with high sensitivity and precision.
Useful for both upward and downward trends, the Ultra Trend is designed to provide visual signals that make it easier to identify potential entry or exit points. Thanks to its design, it is helpful for short-term traders looking to capture early trend shifts and for mid- to long-term traders seeking to confirm the market’s direction.
2. What is the Ultra Trend Indicator?
The Ultra Trend is a technical indicator that captures trend direction through a detailed analysis of recent prices. Unlike more basic indicators, the Ultra Trend uses advanced calculations, applying smoothing filters and price-tracking methods designed to respond to market changes without generating excessive false signals.
This indicator adapts to multiple trading styles, especially useful in markets with clear direction or well-defined trends. Its main advantage is the ability to smooth price movements and filter out market noise, making it easier for traders to identify when a trend begins or ends.
Compared to traditional indicators like moving averages or MACD, the Ultra Trend offers more adaptability and accuracy in trend changes, thanks to its adjustable parameters, allowing traders to fine-tune the analysis according to the specific market or asset.
3. Configuration Parameters
The Ultra Trend features several customizable parameters, allowing traders to tailor the indicator to various strategies and market conditions. These parameters directly influence the sensitivity and accuracy of the generated signals, offering the flexibility needed to suit different trading styles. Below are the main parameters:
- utrPeriod: Defines the base period for indicator calculations. A lower value makes the indicator more sensitive to price changes, while a higher value stabilizes it, making it less reactive to market noise.
- progression: Controls the progression factor in value calculations. Adjusting this parameter enables the indicator to identify trends of varying durations.
- instances: Specifies the number of instances in the Ultra Trend calculation, affecting the depth of analysis. A higher number of instances increases complexity and accuracy, though it may slightly delay response in highly volatile conditions.
- smooth: This parameter applies smoothing to output values, filtering out sudden fluctuations and providing a cleaner analysis of the overall trend.
- smoothPhase: Represents the smoothing phase applied in each calculation. A low value makes the indicator more responsive to trend changes, while a high value makes it more stable and less reactive.
- pow1: Controls the filtering power in calculations. Adjusting this value helps calibrate the filter intensity, which in turn, adjusts the indicator’s capacity to ignore minor market fluctuations.
Each of these parameters can be adjusted to fit specific objectives. For example, traders looking to capture short-term trends may opt for lower values in utrPeriod and smooth, while those preferring to follow broader trends might raise these values.
4. Internal Mechanics and Algorithm
The Ultra Trend employs advanced calculations to identify the market trend accurately, using a set of filters and internal adjustments to smooth out minor fluctuations and focus on the main trend direction. Here are the key elements of its functionality:
- Jurik Method and Smoothing: The indicator applies a smoothing technique known as the Jurik method, designed to reduce market noise without significantly delaying signals. This method smooths both the current and prior bar’s close prices, fine-tuning through the
smoothandsmoothPhaseparameters to filter out minor fluctuations that could trigger false signals. - Trend Variables
valueUpandvalueDn: As calculations progress for each bar, the Ultra Trend accumulates values invalueUpandvalueDn, determining trend direction. IfvalueUpis greater thanvalueDn, the indicator signals an uptrend, and ifvalueDnexceedsvalueUp, a downtrend is detected. - Calculation Loop: The code uses a loop that iterates over a set number of bars (defined by
utrPeriodandprogression) to analyze prices and calculate the trend. Within this loop, multiple smoothing and filtering calculations determine the final values used for signal generation, ensuring signals reflect the ongoing trend rather than short-lived price movements. - Signal Condition: At the end of each calculation, the indicator evaluates whether
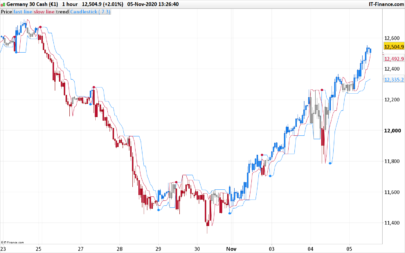
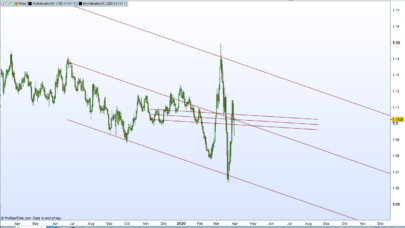
valp(positive trend) is greater thanvalm(negative trend). Based on this result, a signal is generated indicating whether the market is in an uptrend or downtrend. These signals are displayed on the chart via two lines,Ultra trend +andUltra trend -, clearly showing trend direction.
This design makes the Ultra Trend highly adaptable to different markets and trading styles. The combination of smoothing and advanced filtering helps avoid erratic signals caused by short-term volatility, providing a precise interpretation of the trend direction.
5. Signal Interpretation
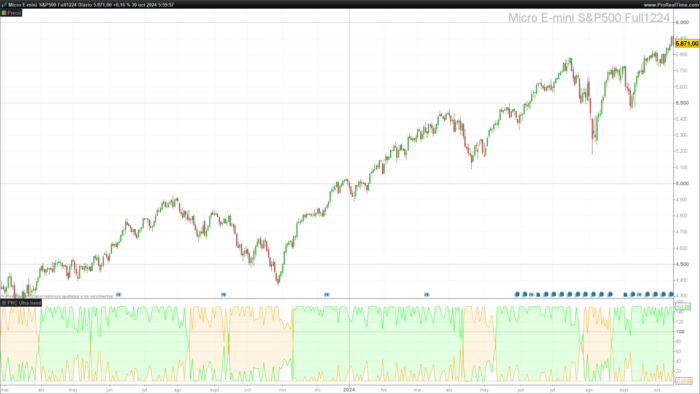
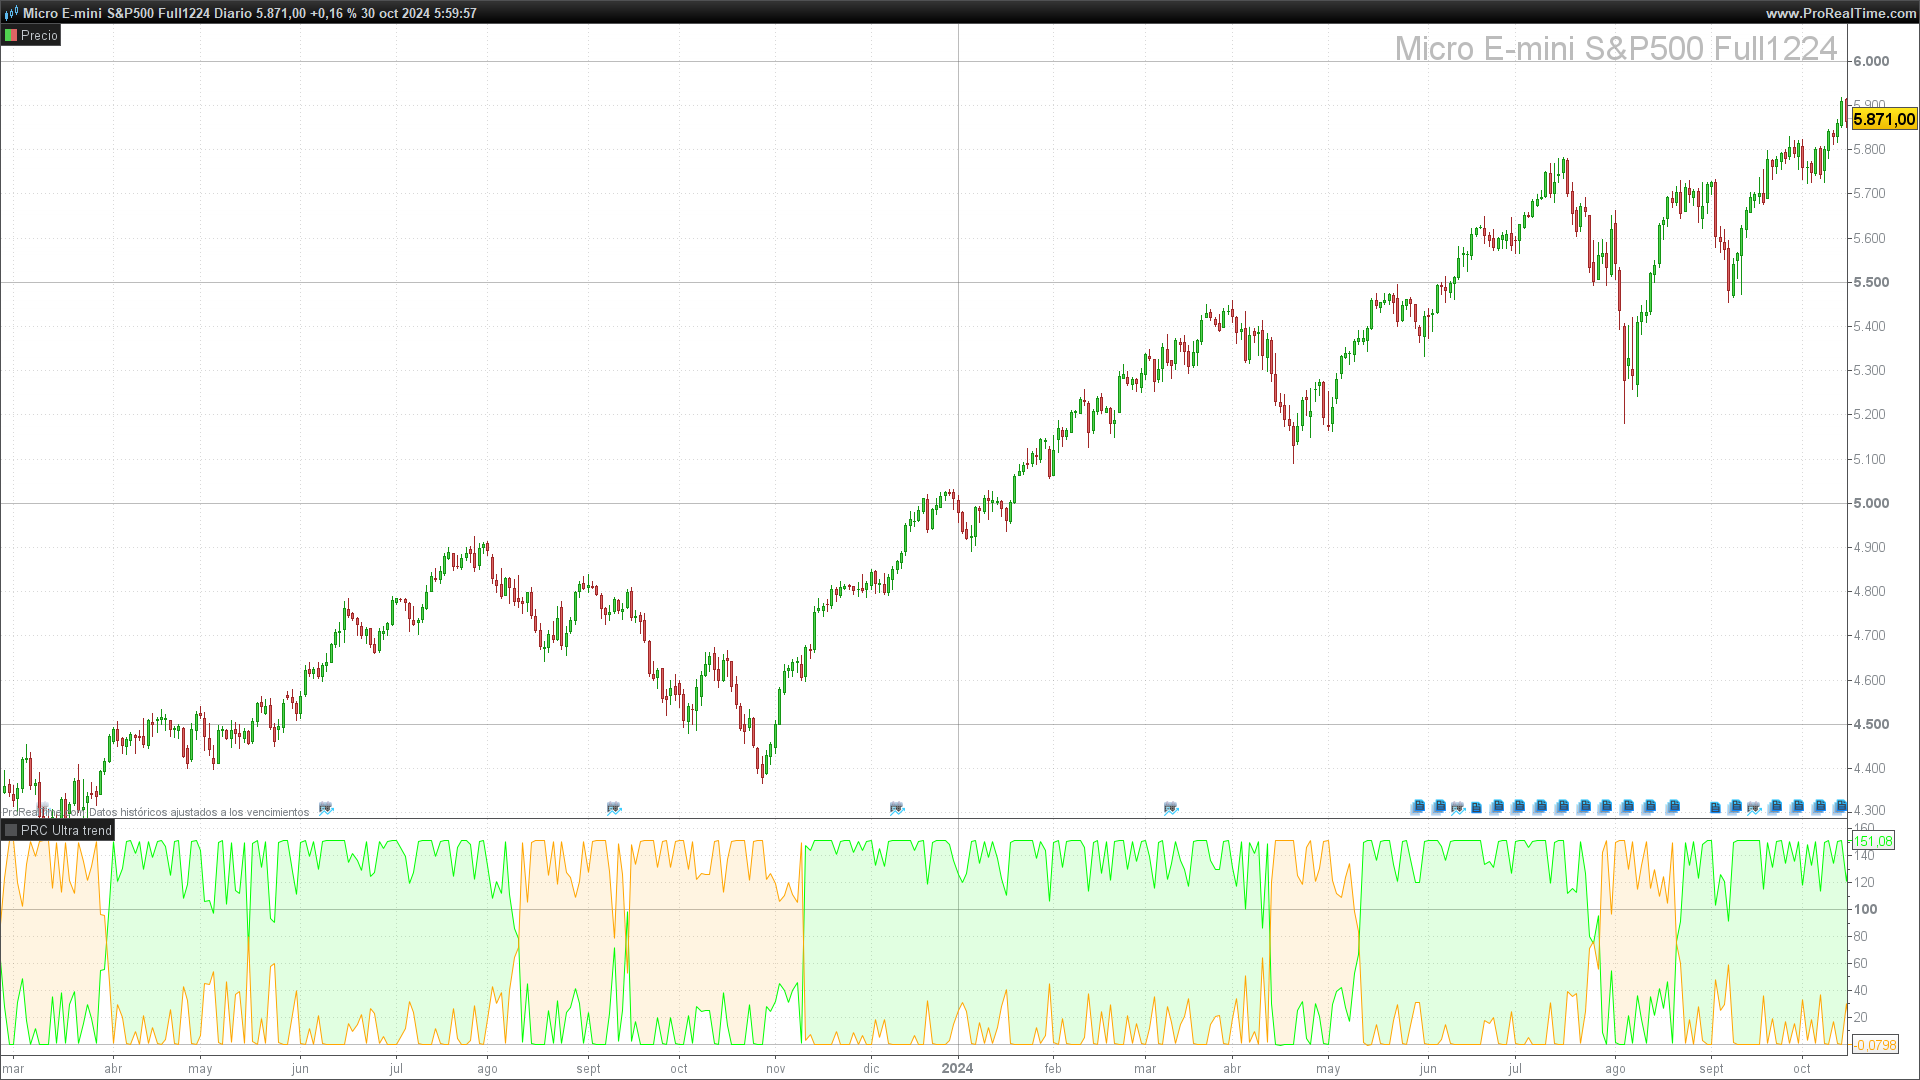
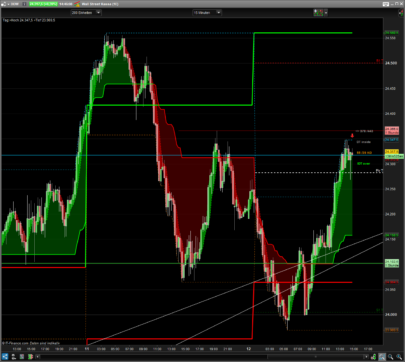
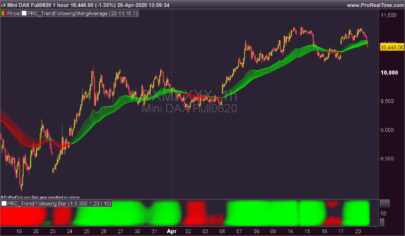
The Ultra Trend provides visual signals through two lines on the chart: Ultra trend +, indicating an uptrend, and Ultra trend -, indicating a downtrend. Interpreting these signals allows traders to identify entry and exit points based on the prevailing market direction.
Signal Interpretation Guide
- Uptrend Signal (
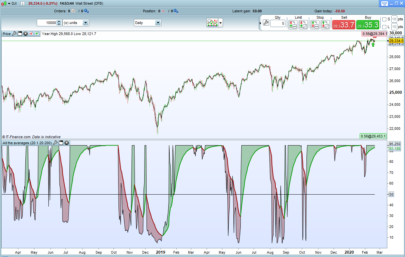
Ultra trend +): Whenvalpexceedsvalm, the indicator shows theUltra trend +line on the chart, typically in green. This indicates that the market may be in an uptrend, suggesting favorable buy opportunities. Traders often open or maintain long positions in this context. - Downtrend Signal (
Ultra trend -): Whenvalmis greater thanvalp, the indicator activates theUltra trend -line, usually in orange. This signal points to a downtrend, and is interpreted as a cue for potential sell opportunities or for reducing long positions. For short traders, this signal may suggest initiating short positions.
Practical Examples on Charts
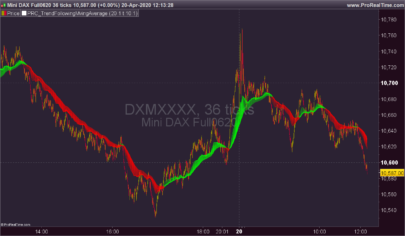
- Trend Reversal: When the
Ultra trend +line crosses above theUltra trend -line, this suggests a trend shift to the upside and is often considered a buy signal. - Trend Confirmation: If both lines maintain their position for several bars (i.e.,
Ultra trend +stays aboveUltra trend -or vice versa), this can be seen as a confirmation of the current trend direction, favoring trend continuation. - False Signals: Although the Ultra Trend is designed to minimize noise, like any indicator, it may produce false signals in extremely volatile or sideways markets. It is recommended to combine this indicator with others for signal confirmation.
The Ultra Trend signals allow traders to act confidently at key moments, capitalizing on trend direction changes and avoiding exposure during high-volatility, noisy market phases.
6. Conclusion and Usage Recommendations
The Ultra Trend is an effective and versatile indicator that provides a clear view of the prevailing market direction, helping traders identify trend changes accurately. Its design, based on advanced smoothing and the Jurik method, enables the user to filter out market noise and focus on meaningful movements.
Usage Recommendations
- Combine with Other Indicators: To improve the reliability of Ultra Trend signals, it’s advisable to use it alongside other indicators, such as RSI or moving averages. This can help confirm trend strength and avoid premature entries or exits in volatile scenarios.
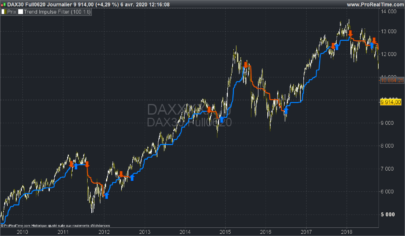
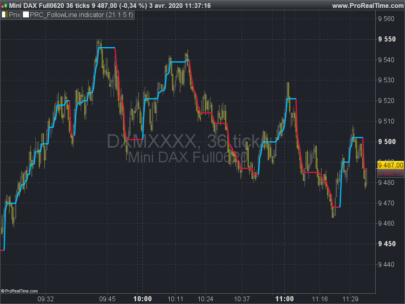
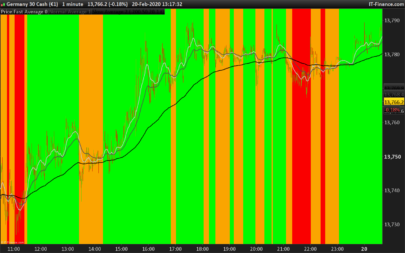
- Adaptation to Different Timeframes: The Ultra Trend adapts to multiple timeframes. On short periods, such as 1- and 5-minute charts, it can capture quick trend changes, although it may be more sensitive to volatility. For longer timeframes, like daily or weekly charts, the smoothing and progression parameters allow for identifying more sustained trend movements.
- Parameter Adjustments by Asset: Depending on the asset and its volatility, it’s recommended to adjust the smoothing (
smooth) and base period (utrPeriod) parameters. Highly volatile assets, such as cryptocurrencies or tech stocks, may require higher smoothing to avoid erratic signals. - Testing and Optimization: Before using the Ultra Trend in a live account, it is advisable to run backtests and optimizations in a testing environment. This helps verify which configurations yield the best results for the specific asset and period of interest, adapting the indicator to the desired trading strategy.
7. Ultra Trend Code
|
1 2 3 4 5 6 7 8 9 10 11 12 13 14 15 16 17 18 19 20 21 22 23 24 25 26 27 28 29 30 31 32 33 34 35 36 37 38 39 40 41 42 43 44 45 46 47 48 49 50 51 52 53 54 55 56 57 58 59 60 61 62 63 64 65 66 67 68 69 70 71 72 73 74 75 76 77 78 79 80 81 82 83 84 85 86 87 88 89 90 91 92 93 94 95 96 97 98 99 100 101 102 103 104 105 106 107 108 109 110 111 112 113 114 115 116 |
//-------------------------------------------------------------// //PRC Ultra trend //version = 0 //23.05.2024 //Iván González @ www.prorealcode.com //Sharing ProRealTime knowledge //-------------------------------------------------------------// defparam calculateonlastbars = 500 // Limits calculations to the last 500 bars //-------------------------------------------------------------// // Input Parameters //-------------------------------------------------------------// utrPeriod = 3 // Base period for trend calculation progression = 5 // Progression factor for trend length instances = 30 // Number of instances used in calculations smooth = 5 // Smoothing factor for trend signal smoothPhase = 100 // Phase adjustment for smoothing pow1 = 6 // Power applied to the filter's beta value //-------------------------------------------------------------// // Main Calculation //-------------------------------------------------------------// if barindex > utrPeriod + progression * instances then // Initialize variables valp = 0 // Stores positive trend value valpc = 0 // Coded positive trend signal valm = 0 // Stores negative trend value valmc = 0 // Coded negative trend signal valueUp = 0 // Counts occurrences of uptrend valueDn = 0 // Counts occurrences of downtrend // Loop through 'k' values from utrPeriod up to the specified progression and instances FOR k = utrPeriod TO (utrPeriod + progression * instances) DO // Calculate Jurik smoothing for the previous close src1 = close[1] period1 = max(k, 1) beta1 = 0.45 * (period1 - 1) / (0.45 * (period1 - 1) + 2) alpha1 = pow(beta1, pow1) corr1 = max(min(smoothPhase, 100), -100) / 100 + 1.5 filt01 = (1 - alpha1) * src1 + alpha1 * filt01[1] det01 = (src1 - filt01[0]) * (1 - beta1) + beta1 * det01[1] filt11 = filt01[0] + corr1 * det01[0] det11 = (filt11[0] - jurik1[1]) * ((1 - alpha1) * (1 - alpha1)) + (alpha1 * alpha1) * det11[1] jurik1 = jurik1[1] + det11[0] // Calculate Jurik smoothing for the current close src2 = close[0] period2 = max(k, 1) beta2 = 0.45 * (period2 - 1) / (0.45 * (period2 - 1) + 2) alpha2 = pow(beta2, pow1) corr2 = max(min(smoothPhase, 100), -100) / 100.0 + 1.5 filt02 = (1 - alpha2) * src2 + alpha2 * filt02[1] det02 = (src2 - filt02) * (1 - beta2) + beta2 * det02[1] filt12 = filt02 + corr2 * det02 det12 = (filt12 - jurik2[1]) * ((1 - alpha2) * (1 - alpha2)) + (alpha2 * alpha2) * det12[1] jurik2 = jurik2[1] + det12 // Compare smoothed values to determine trend direction IF jurik1 < jurik2 THEN valueUp = valueUp + 1 // Increment uptrend count ELSE valueDn = valueDn + 1 // Increment downtrend count ENDIF NEXT // Smoothing applied to the uptrend and downtrend values // Final values for visual display src3 = valueUp period3 = MAX(smooth, 1) beta3 = 0.45 * (period3 - 1) / (0.45 * (period3 - 1) + 2) alpha3 = POW(beta3, pow1) corr3 = MAX(MIN(smoothPhase, 100), -100) / 100.0 + 1.5 filt03 = (1 - alpha3) * src3 + alpha3 * filt03[1] det03 = (src3 - filt03[0]) * (1 - beta3) + beta3 * det03[1] filt13 = filt03[0] + corr3 * det03[0] det13 = (filt13[0] - valp[1]) * ((1 - alpha3) * (1 - alpha3)) + (alpha3 * alpha3) * det13[1] valp = valp[1] + det13[0] // Apply smoothing to downtrend calculations src4 = valueDn period4 = MAX(smooth, 1) beta4 = 0.45 * (period4 - 1) / (0.45 * (period4 - 1) + 2) alpha4 = POW(beta4, pow1) corr4 = MAX(MIN(smoothPhase, 100), -100) / 100.0 + 1.5 filt04 = (1 - alpha4) * src4 + alpha4 * filt04[1] det04 = (src4 - filt04[0]) * (1 - beta4) + beta4 * det04[1] filt14 = filt04[0] + corr4 * det04[0] det14 = (filt14[0] - valm[1]) * ((1 - alpha4) * (1 - alpha4)) + (alpha4 * alpha4) * det14[1] valm = valm[1] + det14[0] //-------------------------------------------------------------// // Define Signal Color Based on Trend Comparison //-------------------------------------------------------------// if valp > valm THEN valpc = 1 // Positive trend condition r = 0 g = 255 b = 0 ELSE valpc = 2 // Negative trend condition r = 255 g = 165 b = 0 endif valmc = valpc endif //-------------------------------------------------------------// // Display Trend Lines with Specified Colors //-------------------------------------------------------------// colorbetween(valp, valm, r, g, b, 30) // Color zone between valp and valm //-------------------------------------------------------------// RETURN valp AS "Ultra trend +" COLOURED(0, 255, 0), valm AS "Ultra trend -" COLOURED(255, 165, 0) |
Share this
No information on this site is investment advice or a solicitation to buy or sell any financial instrument. Past performance is not indicative of future results. Trading may expose you to risk of loss greater than your deposits and is only suitable for experienced investors who have sufficient financial means to bear such risk.
ProRealTime ITF files and other attachments :
Find other exclusive trading pro-tools on ![]()
PRC is also on YouTube, subscribe to our channel for exclusive content and tutorials


Bonjour ivan
Quelle différence il y a t il entre Extra trend et ultra trend lequel est le plus fiable??