







Universal Oscillator John Ehlers
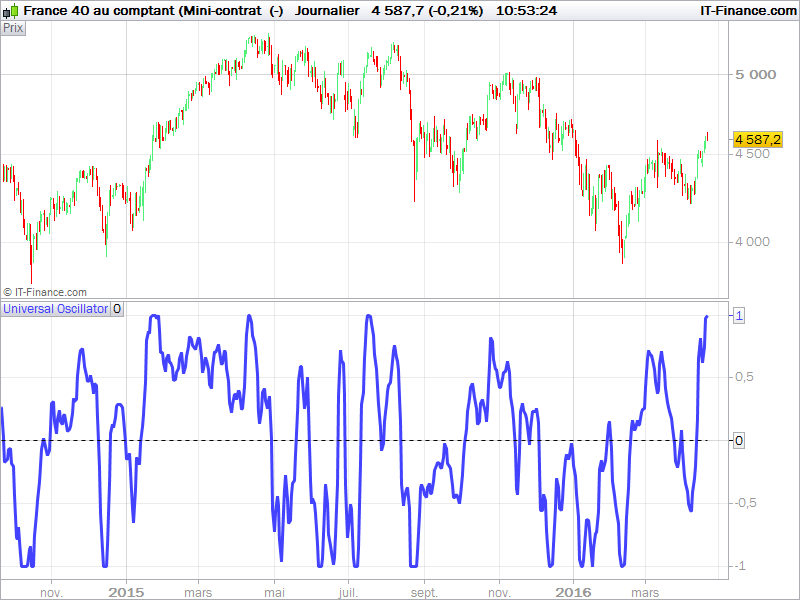
The Universal Oscillator made by John Ehlers is based on article “Whiter is Brighter” wrote in TASC magazine in January 2015.
This oscillator is an evolution of John Ehlers previous indicator “SuperSmoother filter” which was introduced in his January 2014 article “Pedictive and Succeful indicators”.
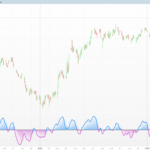
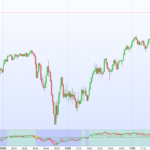
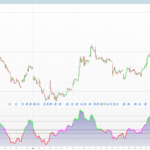
This indicator reflects short term variations of price within the “bandedge” parameter as a frequency. Of course, the lesser this parameter is, the less lag is the oscillator, it is setted at 20 periods by default. Returned values oscillate between -1 and 1.
Basic rules would be to sell short when the curve crosses below 0 and go long when it crosses above 0.
bandedge= 20
whitenoise= (Close - Close[2])/2

if barindex>bandedge then
 // super smoother filter
 a1= Exp(-1.414 * 3.14159 / bandedge)
 b1= 2*a1 * Cos(1.414*180 /bandedge)
 c2= b1
 c3= -a1 * a1
 c1= 1 - c2 - c3
 filt= c1 * (whitenoise + whitenoise[1])/2 + c2*filt[1] + c3*filt[1]

 filt1 = filt

 if ABS(filt1)>pk[1] then
  pk = ABS(filt1)
 else
  pk = 0.991 * pk[1]
 endif

 if pk=0 then
  denom = -1
 else
  denom = pk
 endif

 if denom = -1 then
  result = result[1]
 else
  result = filt1/pk
 endif
endif

RETURN result COLOURED(66,66,255) as "Universal Oscillator", 0 as "0"
Comments
You must be logged in to post a comment.

Hi.
someone may explain to me, please, how expressions like:
filt= c1 * (whitenoise + whitenoise[1])/2 + c2*filt[1] + c3*filt[1]
or
if ABS(filt1)>pk[1] then ... are calculated? I am attempting to replicate the filter in different language but I don't understand those recursive terms: in the first expression filt[1] is not defined, so in the second expression pk[1]. How can the platform calculate them?
Hi Nicholas, hope you are well,
Thanks very much for posting this Ehler's code and also the MESA indicators. It has been quite a revelation learning about his custom filters/oscillators and how superior they are to normal filters like the EMA and Stochastic Oscillator.
I found a pdf called Ehler's Predictive Indicator: http://www.stockspotter.com/files/PredictiveIndicators.pdf
It combines the Optimal Tacking Filter and the Universal Oscillator (Supersmoother) which he simply calls "My Oscillator." Now that both those indicators have been converted here at prorealcode. I was wondering how to combine the two PRT indicators code together and add the bold part of Ehler's code below to get it to work?:
Ehler's Stochastic Indicator = Roofing Filter+Universal Oscillator (SuperSmoother)
The EasyLanguage Code to Compute My Stochastic is:
//My Stochastic Indicator © 2013 John F. Ehlers//
Inputs: Length(20);
Vars: alpha1(0),HP(0),a1(0),b1(0),c1(0),c2(0),c3(0),Filt(0), HighestC(0), LowestC(0), count(0), Stoc(0), MyStochastic(0);
//Highpass Filter cyclic components whose periods are shorter than 48 bars
alpha1 = (Cosine(.707*360 / 48) + Sine (.707*360 / 48) - 1) / Cosine(.707*360 / 48); HP = (1 - alpha1 / 2)*(1 - alpha1 / 2)*(Close - 2*Close[1] + Close[2]) + 2*(1 - alpha1)*HP[1] - (1 - alpha1)*(1 - alpha1)*HP[2];
//Smooth with a Super Smoother Filter
a1 = expvalue(-1.414*3.14159 / 10); b1 = 2*a1*Cosine(1.414*180 / 10); c2 = b1;
c3 = -a1*a1;
c1 = 1 - c2 - c3;
Filt = c1*(HP + HP[1]) / 2 + c2*Filt[1] + c3*Filt[2];
HighestC = Filt;
LowestC = Filt;
For count = 0 to Length - 1 Begin
If Filt[count] > HighestC then HighestC = Filt[count];
If Filt[count] < LowestC then LowestC = Filt[count]; End;
Stoc = (Filt - LowestC) / (HighestC - LowestC);
MyStochastic = c1*(Stoc + Stoc[1]) / 2 + c2*MyStochastic[1] + c3*MyStochastic[2];
Plot1(MyStochastic); Plot2(.8);
Plot6(.2);
Any help would be greatly appreciated,
Cheers,
Best
Brad

This is a such a great filter, but you know what happens when the bandedge value is incorrect... What if it was coded to self optimise much in the same way that Cynthia Kase's Peak Oscillator did -- https://www.prorealcode.com/prorealtime-indicators/kase-peak-oscillator-v2/ -- is that even possible @nicolas?