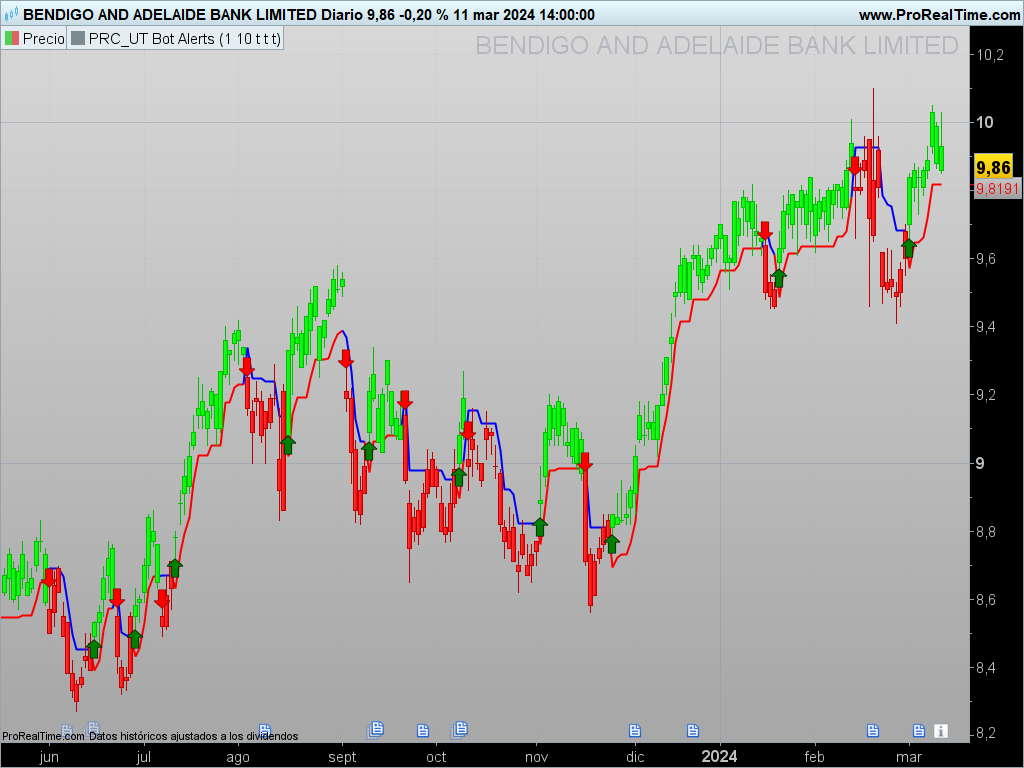
The UT Bot alerts indicator is a typical trend following indicator.
The UT Bot Alerts is based on the price position and its trail stop.
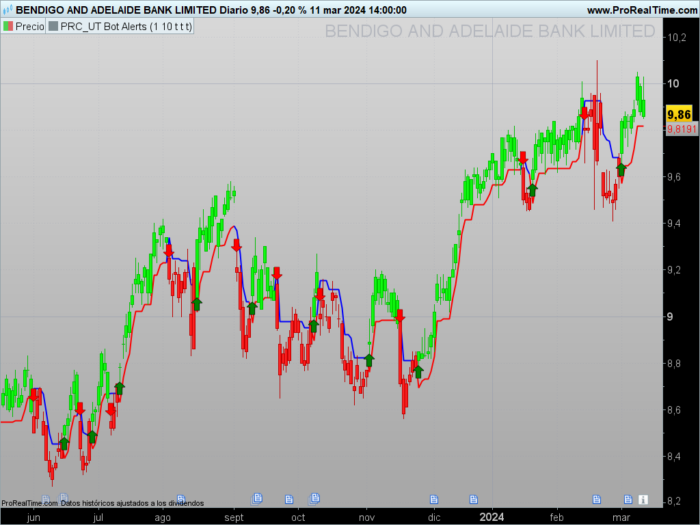
When the price is above its trail stop the indicator is in an uptrend, and therefore the candles are coloured green, signalling the beginning of a trend with a green arrow.
When the price is below its trail stop the indicator is in a downtrend and the candlesticks are coloured red, marking the beginning of the trend with a red arrow.
Accompanying the price is a trail stop line which is based on the difference between the price and x times its ATR. This makes it a suitable indicator for all types of volatility, as it adjusts according to the market.
Indicator configuration:
– Type of closure: heikin ashi or not.
– a: factor that multiplies the ATR. Provides more or less sensitivity to price movements.
– c: ATR periods.
You can also configure the indicator to show or not the arrows and the colour of the candles.
|
1 2 3 4 5 6 7 8 9 10 11 12 13 14 15 16 17 18 19 20 21 22 23 24 25 26 27 28 29 30 31 32 33 34 35 36 37 38 39 40 41 42 43 44 45 46 47 48 49 50 51 52 53 54 55 56 57 58 59 60 61 62 63 64 65 66 67 68 69 70 71 72 73 74 75 76 77 78 79 80 81 82 83 84 85 86 87 88 89 90 91 92 93 |
//PRC_UT Bot Alerts //version = 1 //15.02.24 //Iván González @ www.prorealcode.com //Sharing ProRealTime knowledge ///inputs a = 1 //Key Vaule. 'This changes the sensitivity' - Decimal c = 10 //ATR period - Integer drawsignals = 1 //Show arrows - Boolean colorcandles = 1 //Color candles - Boolean heikin = 1 // boolean. True work as Heikin A ///////////////// xatr = averagetruerange[c](close) nLoss = a * xatr if heikin then src = (open+close+high+low)/4 else src = close endif if barindex < c then xatrTrailingStop = undefined pos = 0 else if src > xatrTrailingStop[1] and src[1] > xatrTrailingStop[1] then xAtrTrailingStop = max(xatrTrailingStop[1],src-nLoss) else if src < xatrTrailingStop[1] and src[1] < xatrTrailingStop[1] then xAtrTrailingStop = min(xatrTrailingStop[1],src+nLoss) else if src > xatrTrailingStop[1] then xAtrTrailingStop = src-nLoss else xAtrTrailingStop = src+nLoss endif endif endif if src[1] < xatrTrailingStop[1] and src > xAtrTrailingStop[1] then pos = 1 r=250 g=0 b=0 else if src[1] > xatrTrailingStop[1] and src < xatrTrailingStop[1] then pos = -1 r=0 g=0 b=250 else pos = pos[1] endif endif endif ///////Trading conditions ema = average[1](src) above = ema crosses over xatrTrailingStop below = ema crosses under xatrTrailingStop buy1 = src > xatrTrailingStop and above sell1 = src < xatrTrailingStop and below barbuy = src > xatrTrailingStop barsell = src < xatrTrailingStop //////Plot signals and candles if drawsignals then if buy1 then drawarrowup(barindex,low-0.15*averagetruerange[10])coloured("green") elsif sell1 then drawarrowdown(barindex,high+0.15*averagetruerange[10])coloured("red") endif endif if colorcandles then if barbuy then rbar=0 gbar=250 bbar=0 elsif barsell then rbar=250 gbar=0 bbar=0 else rbar=125 gbar=125 bbar=125 endif DRAWCANDLE(open, high, low, close)coloured(rbar,gbar,bbar) endif return xatrTrailingStop as "Trailing Stop" coloured(r,g,b)style(line,2) |
Share this
No information on this site is investment advice or a solicitation to buy or sell any financial instrument. Past performance is not indicative of future results. Trading may expose you to risk of loss greater than your deposits and is only suitable for experienced investors who have sufficient financial means to bear such risk.
ProRealTime ITF files and other attachments :PRC is also on YouTube, subscribe to our channel for exclusive content and tutorials






Hi Ivan,
Could you make a Proscreener with this indicator when a buy and a sell signal (green and red arrows) appear? Also, how would you filter the arrows (buy or sell order) when there is no much movement in the market to avoid entering in the market?
Hi, to avoid range markets you could combine this indicator with ADX for example or another one.
If you want to create a screener you only have to delete all drawing/plotting lines and delete variables not used in the screener.
//PRC_UT Bot Alerts
//version = 1
//15.02.24
//Iván González @ http://www.prorealcode.com
//Sharing ProRealTime knowledge
///inputs
a = 1.3 //Key Vaule. ‘This changes the sensitivity’ – Decimal
c = 10 //ATR period – Integer
heikin = 1 // boolean. True work as Heikin A
/////////////////
xatr = averagetruerange[c](close)
nLoss = a * xatr
if heikin then
src = (open+close+high+low)/4
else
src = close
endif
if barindex < c then
xatrTrailingStop = undefined
pos = 0
else
if src > xatrTrailingStop[1] and src[1] > xatrTrailingStop[1] then
xAtrTrailingStop = max(xatrTrailingStop[1],src-nLoss)
else
if src < xatrTrailingStop[1] and src[1] < xatrTrailingStop[1] then
xAtrTrailingStop = min(xatrTrailingStop[1],src+nLoss)
else
if src > xatrTrailingStop[1] then
xAtrTrailingStop = src-nLoss
else
xAtrTrailingStop = src+nLoss
endif
endif
endif
if src[1] < xatrTrailingStop[1] and src > xAtrTrailingStop[1] then
pos = 1
else
if src[1] > xatrTrailingStop[1] and src < xatrTrailingStop[1] then
pos = -1
else
pos = pos[1]
endif
endif
endif
///////Trading conditions
ema = average[1](src)
above = ema crosses over xatrTrailingStop
//below = ema crosses under xatrTrailingStop
buy1 = src > xatrTrailingStop and above
//sell1 = src < xatrTrailingStop and below
screener[buy1]
It would be great. Thank you!
Hola Iván, ¿sería posible crear un screener que indique cuándo las velas coloreadas del indicador “Linear Regression Candles” cruzan por encima de este indicador UT Bot Alerts indicator?
Muchas gracias
Ivan thank you for the pro-screener. I a trying to understand how to write the signals from your indicator into code. I am looking at your proscreener and indicator but I don´t get where the “buy” and “sell” signals are triggered or what part of the code is for “buy” and what part is for “sell”. Can you please tell us what the code for “buy” and for “sell” is? I would like to use them.
Hi,
Lines 62 and 63. These lines define buy and sell conditions.