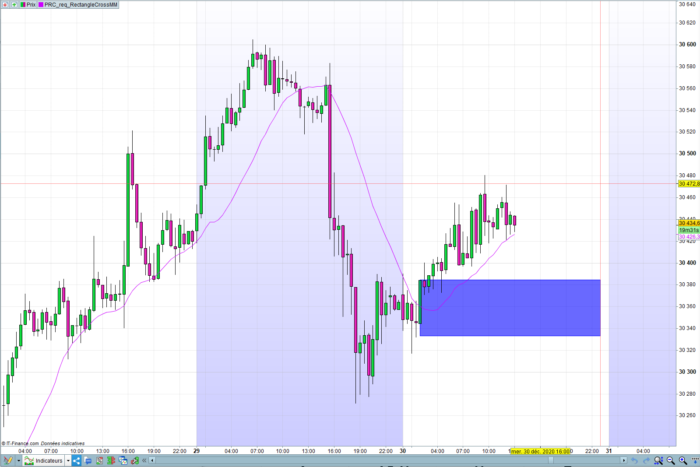
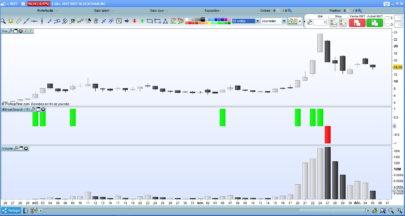
A request was made in the Probuilder forum, to display a rectangle starting from the price crossing a moving average 20 and continuing to the right of the price thanks to v11 new capability, with same height as breakout candle, and only showing the latest active occurrence.
Use N as how many bars to the right of the latest price you want to extend the rectangle to.
Use period to customise the moving average
It is not much to look at in terms of graphic output, but if you recently had an update to PRT v11, it shows you the simplest way to code a self-refreshing drawing in the present triggered by a single event in the past and still able to extend in a constant way in the future no matter how long ago the triggering event was.
Therefore you can use the concept and easily adapt the code with something else than a moving average to suit many other needs you may have to highlight anything.
|
1 2 3 4 5 6 7 8 9 10 11 12 13 14 15 16 17 18 19 20 21 22 |
// PRC MM20 break rectangle // 21.12.2020 mod 30.12.2020 // Noobywan @ www.prorealcode.com // Sharing ProRealTime Knowledge // Forum ProBuilder user Remy92400 request defparam DRAWONLASTBARONLY=true N=15 //or set as external parameter period=20 //or set as external parameter mm=Average[period](close) if (close crosses over mm or close crosses under mm) then barre=barindex haut=high bas=low endif DRAWRECTANGLE(barre, bas, barindex+N, haut) coloured (0,0,255,150) bordercolor(0,0,255) return mm |
Share this
No information on this site is investment advice or a solicitation to buy or sell any financial instrument. Past performance is not indicative of future results. Trading may expose you to risk of loss greater than your deposits and is only suitable for experienced investors who have sufficient financial means to bear such risk.
ProRealTime ITF files and other attachments :
Find other exclusive trading pro-tools on ![]()
PRC is also on YouTube, subscribe to our channel for exclusive content and tutorials


Bonjour Noobywan,
si je comprends bien l’utilisation de ce code que je trouve particulièrement intéressant,
on achète de suite au dessus du rectangle qui correspond donc au breakout et à l’inverse sous le rectangle pour une vente
C’est bien ça.
Merci pour une confirmation
Cordialement
Bonjour, quand la question a été posée dans le forum à celui qui avait fait la requête en amont du code (lien ci-dessus dans le texte “continuer dessin vers la droite”), il n’y a pas eu à ce jour de réponse sur la façon dont il l’utilisait. Je me garderai bien de répondre à sa place sur ses intentions. Je peux juste ajouter qu’à titre personnel je n’utilise pas un franchissement de moyenne mobile comme signal d’un trade ou sa trace passée comme signal du trade opposé, ni les stratégies de breakout. Et que c’était une requête probablement davantage graphique que de trading systématique. L’intérêt graphique du code était fin 2020 au déploiement de la v11pour les comptes IG de montrer à tous les nouveaux utilisateurs v11 qui n’avaient pas encore en main les nouvelles possibilités quand le forum regorgeait de questions sur celles-ci, qu’on pouvait désormais grapher sur la droite du prix pas seulement de façon statique mais aussi dynamique.
This Code draws only a retangle if the condition has been confirmed and NOT before (in that case a simple crosses over SMA)
defparam DRAWONLASTBARONLY = true
sma5 = Average[5](close)
BeginnRechteck = 5
EndeRechteck = 15
Counter = LastSet($RechteckStartBar) + 1
if barindex > 1 and (close[1] crosses over sma5[1]) then
ObereSeite = close[1] + 40 * pipsize
UntereSeite = close[1]
// Speichert die Koordinaten des Rechtecks in Array-Variablen
$RechteckStartBar[Counter] = barindex – 1 + BeginnRechteck
$RechteckEndBar[Counter] = barindex – 1 + EndeRechteck
$RechteckObereSeite[Counter] = ObereSeite
$RechteckUntereSeite[Counter] = UntereSeite
// Aktualisieren des Zählers
Counter = Counter + 1
endif
// Zeichnet alle gespeicherten Rechtecke im Chart
for i = 0 to LastSet($RechteckStartBar) do
DRAWRECTANGLE($RechteckStartBar[i], $RechteckObereSeite[i], $RechteckEndBar[i], $RechteckUntereSeite[i]) coloured(0, 0, 255, 20) bordercolor(0, 0, 150)
next
return
https://ibb.co/Fsqh4bj