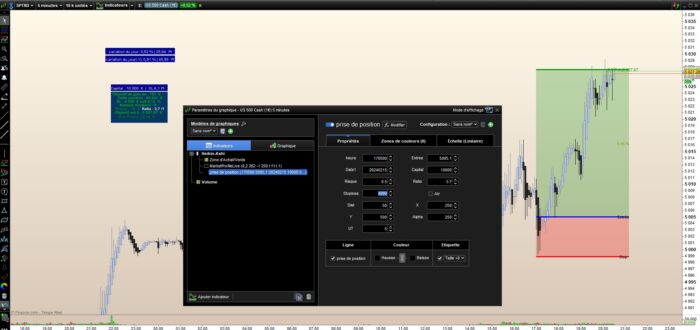
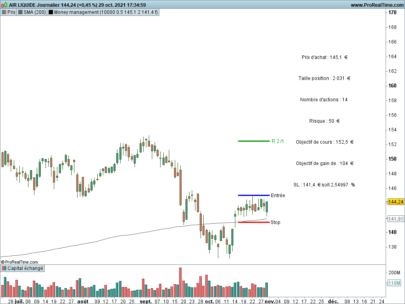
This script is designed for traders who wish to automate their trading strategies on the ProRealTime platform, focusing on risk management and trade execution based on specific market conditions. It incorporates initial capital, risk percentage, entry point (In), risk-reward ratio (Ratio), and whether to adjust the stop loss based on the Average True Range (ATR), providing a comprehensive approach to managing trades. The code calculates the number of shares to buy, the risk in euros, and the position size based on the trader’s specified risk level and capital. It also determines the profit target based on the entry price and the risk-reward ratio.
Visual aids are a significant aspect of this script, offering traders graphical representations of entry points, stop loss levels, and profit targets directly on their trading charts. It includes conditions for drawing arrows and rectangles to indicate these key levels, enhancing the decision-making process with clear visual cues. Additionally, the script features text annotations to display vital information such as stop loss in euros and percentage, capital, position size, and potential profit, making it easier for traders to assess their positions at a glance.
The script also handles day-to-day price variations, showing daily percentage changes and differences in points for the current and previous days, aiding traders in understanding market movements relative to their trades. These features aim to support traders in making more informed decisions by providing a detailed overview of their trading setup, potential risks, and rewards directly on their trading platform.
|
1 2 3 4 5 6 7 8 9 10 11 12 13 14 15 16 17 18 19 20 21 22 23 24 25 26 27 28 29 30 31 32 33 34 35 36 37 38 39 40 41 42 43 44 45 46 47 48 49 50 51 52 53 54 55 56 57 58 59 60 61 62 63 64 65 66 67 68 69 70 71 72 73 74 75 76 77 78 79 80 81 82 83 84 85 86 87 88 89 90 91 92 93 94 95 96 97 98 99 100 101 102 103 104 105 106 107 108 109 110 111 112 113 114 115 116 117 118 119 120 121 122 123 124 125 126 127 128 129 130 131 132 133 134 135 136 137 138 139 140 141 142 143 144 145 146 147 148 149 150 151 |
// Variables : // Capital, entier, défault 10000 // Risque : decimal, défault 1 // In : decimal // Ratio : entier, défault 2 // Stoploss : decimal // Atr : boolean, défault false // Initialisation des variables ONCE Compteur = 0 once Compteur=0 In = Entree PH1d = Date1 PH1t = heure//091000 h1=Openhour[1] m1=Openminute[1] mm1=Openmonth y1=Openyear dife=(close[0]-Dclose(1)) pourc=round(((close[0]-Dclose(1))/dclose(1)*100),2) dife1=(dclose(1)-Dclose(2)) pourc1=round(((dclose(1)-Dclose(2))/dclose(1)*100),2) if Atr then LeR = In - (stoploss - AverageTrueRange[14](close)) slAtr = stoploss - AverageTrueRange[14](close) else LeR=In-stoploss slAtr = 0 endif NiveauRatio=ROUND(In+LeR*ratio,2) sl = LeR/In slEnPourcent = round((sl*100),2) nbactions = round(((risque/100)/sl*capital)/In) risqueEnEuros =ROUND( risque/100*capital) taillepose = (round(nbactions*In)) objectifGain = round(NiveauRatio*nbactions-nbactions*In) indexSl = In*1.01 indexGain = In*1.03 indexObj = In*1.05 indexRisque = In*1.07 indexNbaction = In*1.09 indextaillePos = In*1.11 indexPrixAchat = In*1.13 d2=round((dist*UT)/60,2) d3=round(d2/24,0) V=round(((NiveauRatio-In)*pourc)/dife,2) hh=NiveauRatio-(NiveauRatio-In)*0.5 pt=abs(NiveauRatio-In) limit10 = 2*pipsize if (close[1]<NiveauRatio-Limit10)and (close[0]>NiveauRatio+Limit10) then drawarrowup(barindex,low-Limit10) ToucheLigneTest = 1 if ToucheLigneTest=1 then Compteur=1 DRAWTEXT("Trade Gagnant ✔", 95+X,34+Y,Dialog,Bold,10)anchor(bottomleft) coloured(180,180,0,255) endif else ToucheLigneTest = 0 endif if opendate = PH1D and time= PH1t then signal=1 DRAWSEGMENT(barindex, stoploss, barindex+dist, stoploss) coloured(255,0,0) style(line,3) DRAWSEGMENT(barindex, In, barindex+dist, In) coloured(0,0,255) style(line,3) DRAWSEGMENT(barindex, NiveauRatio, barindex+dist, NiveauRatio) coloured(0,155,0) style(line,3) drawrectangle(barindex, stoploss,barindex+dist, In)coloured(255,0,0,alpha/4)bordercolor(250,0,0,1) drawrectangle(barindex, NiveauRatio,barindex+dist, In)coloured(0,130,0,alpha/4)bordercolor(0,130,0,1) if d2<=24 then DRAWTEXT("#d2# heures | #pt#pt ", barindex+dist/2, NiveauRatio+15*pipsize) coloured(0,155,0) else DRAWTEXT("#d3# jours | #pt#pt", barindex+dist/2, NiveauRatio+15*pipsize) coloured(0,155,0) endif endif if islastbarupdate then Once BarIndexPH1 = 0 Once BarIndexPH2 = 0 Once BarIndexPB1 = 0 Once TradingActif = 0 drawrectangle(25+X,112+Y,180+X,130+Y)anchor(bottomleft)coloured(0,0,150,alpha)bordercolor(0,50,100,0) drawrectangle(25+X,25+Y,180+X,110+Y)anchor(bottomleft)coloured(0,50,100,alpha)bordercolor(0,50,100,0) jour=Openday if Atr then DRAWSEGMENT(barindex, slAtr, barindex+dist, slAtr) coloured(255,0,0) style(dottedline,2) DRAWTEXT("stop - ATR", barindex, slAtr) DRAWTEXT("SL - ATR : #slAtr# soit #slEnPourcent# %", barindex+25, indexSl) else if islastbarupdate then if signal=1 then DRAWTEXT("Stop", barindex+5, stoploss) DRAWTEXT("Entrée", barindex+5, In) DRAWTEXT("R #ratio#/1 |#NiveauRatio#", barindex+5, NiveauRatio) coloured(0,155,0) DRAWTEXT("#V#%", barindex+5, hh) coloured(150,155,0) endif endif endif Tg1=0 distance=(close-in) if close >In then r=0 g=130 b=0 else r=255 g=0 b=0 endif SL1=abs(stoploss-in) if SL1<risqueEnEuros then r1=0 g1=130 b1=0 else r1=255 g1=0 b1=0 endif DRAWTEXT("SL : #stoploss# € soit #slEnPourcent# %", 100+X,85+Y,Dialog,Bold,10)anchor(bottomleft) coloured(0,180,0,255) DRAWTEXT("SL:#SL1#Pt",150+X,121+Y,Dialog,Bold,10)anchor(bottomleft) coloured(210,210,210,alpha) DRAWTEXT("Capital : #capital# € |",73+X,121+Y,Dialog,Bold,10)anchor(bottomleft) coloured(210,210,210,alpha) DRAWTEXT("Taille position : #taillepose# €",105+X,95+Y,Dialog,Bold,10)anchor(bottomleft) coloured(0,180,0,255) DRAWTEXT("Nombre d'actions : #nbactions#", 100+X,75+Y,Dialog,Bold,10)anchor(bottomleft) coloured(0,180,0,255) DRAWTEXT("Risque : #risqueEnEuros# €", 70+X,65+Y,Dialog,Bold,10)anchor(bottomleft) coloured(r1,g1,b1,255) DRAWTEXT("Ratio : #Ratio#/1", 140+X,65+Y,Dialog,Bold,10)anchor(bottomleft) coloured(250,250,250,255) DRAWTEXT("Objectif est à : #NiveauRatio# €", 100+X,55+Y,Dialog,Bold,10)anchor(bottomleft) coloured(0,180,0,255) DRAWTEXT("Objectif de gain de : #objectifGain# €", 95+X,105+Y,Dialog,Bold,10)anchor(bottomleft) coloured(0,180,0,255) DRAWTEXT("Dist Prix/In: #Distance# €", 95+X,43+Y,Dialog,Bold,10)anchor(bottomleft) coloured(r,g,b,255) // drawrectangle(10+X,212+Y,200+X,230+Y)anchor(bottomleft)coloured(0,0,150,alpha)bordercolor(0,50,100,0) DRAWTEXT("variation du jour: #POURC#% | #dife# Pt",105+X,221+Y,Dialog,Bold,10)anchor(bottomleft) coloured(210,210,210,alpha) drawrectangle(10+X,191+Y,200+X,209+Y)anchor(bottomleft)coloured(0,0,150,alpha)bordercolor(0,50,100,0) DRAWTEXT("variation du jour(-1): #POURC1#% | #dife1# Pt",105+X,200+Y,Dialog,Bold,10)anchor(bottomleft) coloured(210,210,210,alpha) signal=0 endif RETURN |
Share this
No information on this site is investment advice or a solicitation to buy or sell any financial instrument. Past performance is not indicative of future results. Trading may expose you to risk of loss greater than your deposits and is only suitable for experienced investors who have sufficient financial means to bear such risk.
ProRealTime ITF files and other attachments :PRC is also on YouTube, subscribe to our channel for exclusive content and tutorials


