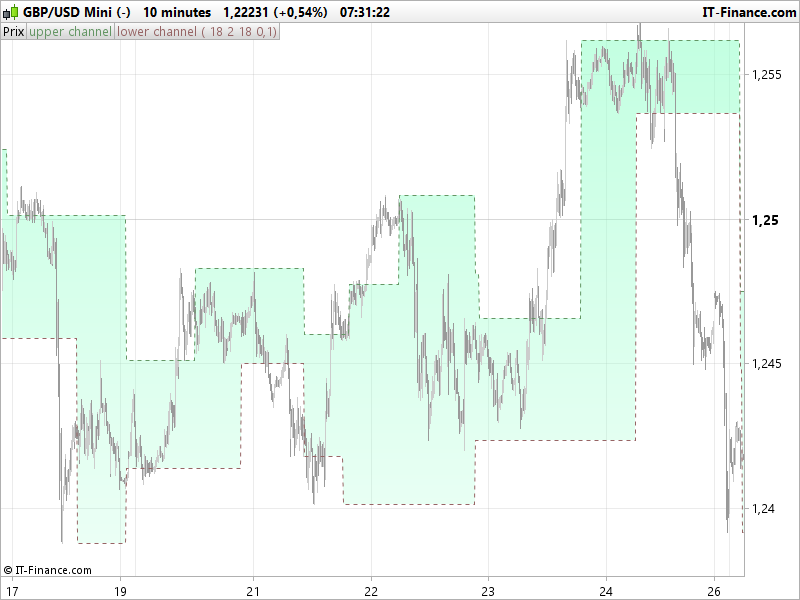
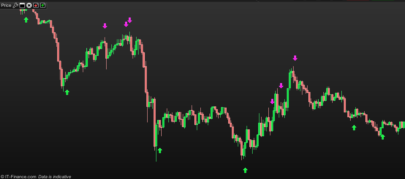
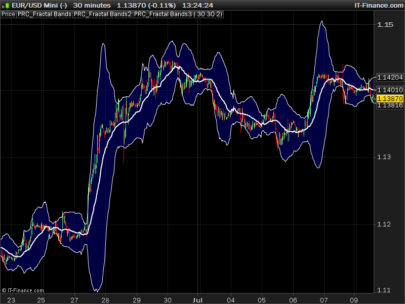
The Volatility Cycle Breakout indicator draws range boxes overlaid on the price chart. The upper and lower side of the boxes are made from recent Fractals. New boxes will be drawn only if the volatility is weak and if the new fractals discovered are far enough from the current upper and lower ones.
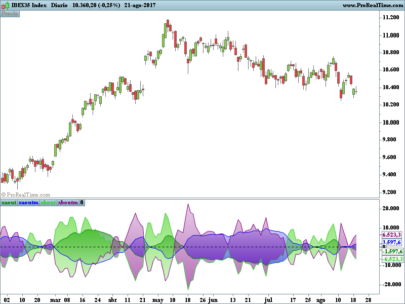
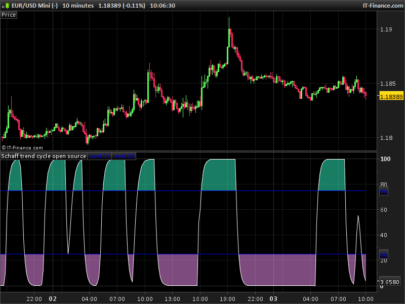
The volatility cycle is extracted from Bollinger Bands (InpBandsPeriod=18 is the bands period). Original indicator is here: Volatility Cycle
Fractals lookback periods can be adapted to catch new fractals far in the history or near of the current price (cp=10).
The “change” variable is the percent variation needed to change the support and resistance levels of the boxes (0.1% seems to work fine for intraday timeframes on forex pairs for instance). This setting is important because it will reduce the noises of “moving boxes” each time new Fractals are discovered, specially when price is ranging. It results perfect range boxes on price to play mean reversion strategy when price is not moving enough to make real breakout.
Original concept (modified since) come from a topic in French forum.
All ideas are welcome and could result in new good indicators, don’t hesitate to post them in forums!
|
1 2 3 4 5 6 7 8 9 10 11 12 13 14 15 16 17 18 19 20 21 22 23 24 25 26 27 28 29 30 31 32 33 34 35 36 37 38 39 40 41 42 43 44 45 46 47 48 49 50 51 52 53 54 55 56 57 58 59 60 |
//PRC_Volatility Cycle Breakout | indicator //03.10.2017 //Nicolas @ www.prorealcode.com //Sharing ProRealTime knowledge //--- parameters //InpBandsPeriod=18 // Period //Smooth=2 // Smoothness //cp=10 // Fractals periods //change=0.1 // Percent change to modify the upper/lower channel //--- end of parameters //Cycle StdDev = std[InpBandsPeriod](close) highindex = highest[InpBandsPeriod](StdDev)[1] lowindex = lowest[InpBandsPeriod](StdDev)[1] if barindex>InpBandsPeriod then VolDer = (StdDev-highindex)/(highindex-lowindex) VolSmooth = average[Smooth](VolDer) if VolSmooth>0 then VolSmooth = 0 elsif VolSmooth<-1.0 then VolSmooth = -1.0 endif endif //fractals if high[cp] >= highest[2*cp+1](high) then LH = 1 else LH = 0 endif if low[cp] <= lowest[2*cp+1](low) then LL = -1 else LL = 0 endif if LH = 1 then TOPy = high[cp] endif if LL = -1 then BOTy = low[cp] endif //channel if VolSmooth = -1.0 then //no volatility if abs(TOPy-upperchannel)/close>change/100 then upperchannel = TOPy endif if abs(BOTy-lowerchannel)/close>change/100 then lowerchannel = BOTy endif endif RETURN upperchannel coloured(100,150,100) style(dottedline) as "upper channel", lowerchannel coloured(150,100,100) style(dottedline) as "lower channel" |
Share this
No information on this site is investment advice or a solicitation to buy or sell any financial instrument. Past performance is not indicative of future results. Trading may expose you to risk of loss greater than your deposits and is only suitable for experienced investors who have sufficient financial means to bear such risk.
ProRealTime ITF files and other attachments :
Find other exclusive trading pro-tools on ![]()
PRC is also on YouTube, subscribe to our channel for exclusive content and tutorials


Bonjour,
Bravo Nicolas pour l’indicateur, est il possible d’en sortir un screener ?
Merci
Hi Nicolas,
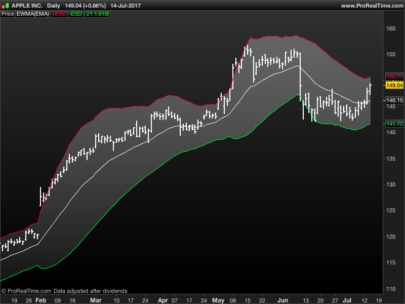
thanks a lot for you contribution here. I never learned scripting, so I am dependend on guys like you who share their work, so thanks again. I would like to know if its´complicated to code something similar to Bollinger Bands, but formed out of two moving averages. It would be great if the colour of the sma or ema “cloud” could change, once the moving averages cross. I am a long time dreamer of such a cloud in the price field, where I can chose ema or sma and the number of them (20,50,34, whatever). Or does such indicator already exist in PRT? I searched a lot but could not find anything.
Hi Marius, for new indicator code request, please use the ProBuilder forum instead! : https://www.prorealcode.com/forum/prorealtime-english-forum/probuilder-support/
Thanks a lot.
Bonjour Nicolas
l’idee du screener serait de sortir les actifs dont le prix se situerait à l’intérieur de la boxe lors de la baisse de la volatilité afin de préparer la sortie à la hausse ou à la baisse.
Je ne sais pas si cela est assez clair.
Oui bien sûr, il faudrait créer une demande spécifique dans le forum dédié à ProBuilder, merci.
Bonjour
c’est fait j’ai mis la demande dans le forum français pro screener, c’est bien la qu’il fallait ouvrir le tropic ?
Merci encore pour le travail.
Thank you Nicolas,
I have copied your nice indicator, but it shows in the lower part of the chart instead of overlapping the price chart.
What am I missing?
Many thanks
Francesco
hi , you need to add the indicator from the “price” menu in chart
Thank you Abz!
Hi Nicolas, this is an interesting strategy. For long position, I assume entry when prices crosses over the upper band. For exit, do you recommend prices crosses under the upper band, or prices crosses under the lower band? What’s your thoughts?