The Volatility Compression Breakout indicator is designed to identify periods of low volatility followed by potential market breakout opportunities. It aims to capture moments when the price consolidates within a narrow range, indicating a decrease in volatility, and anticipates a subsequent expansion in price movement. This indicator can be applied to any financial instrument and period.
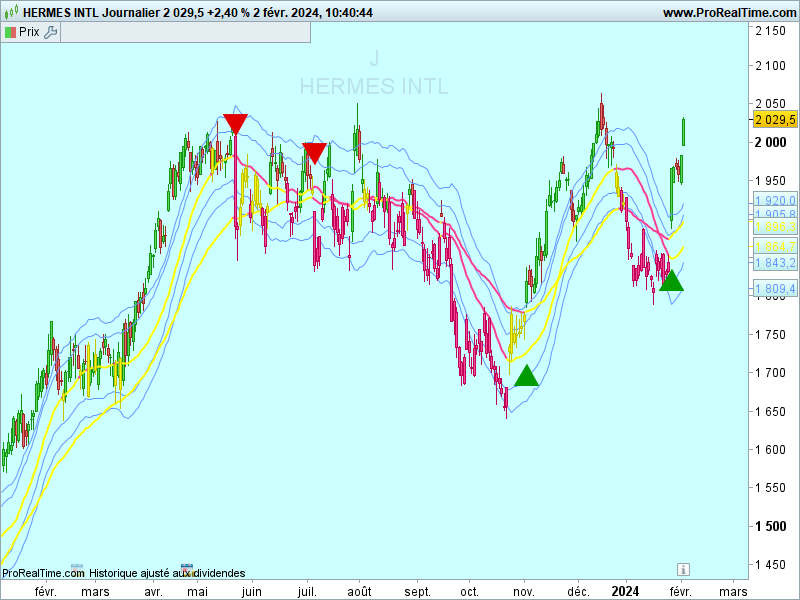
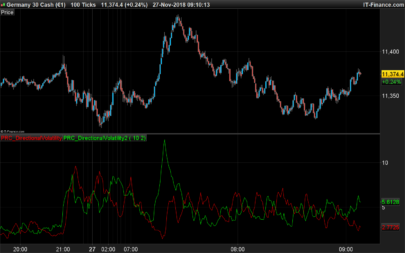
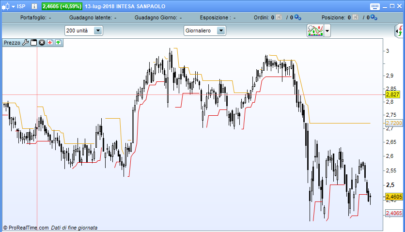
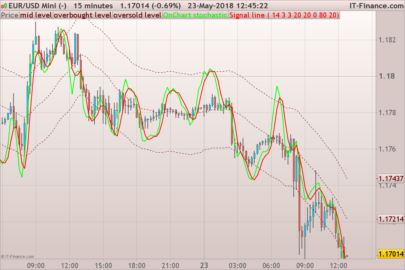
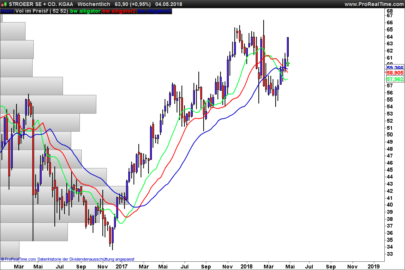
When the closing price is above both the Keltner median line and the exponential moving average (EMA), the bars are lime green, indicating potential bullish market sentiment. When the closing price is positioned above the Keltner Middle but below the EMA, or below the Keltner Middle but above the EMA, the bars are yellow, signifying a neutral or undecided market condition. Conversely, when the closing price falls below the Keltner Middle and the EMA, the bars are fuchsia, suggesting potentially bearish market sentiment.
What’s more, the coloring of the Keltner Middle line and the EMA provide additional visual clues for assessing the trend. When the closing price is above the Keltner Middle, the line is colored lime green, indicating a bullish trend. Conversely, when the closing price is below the Keltner Middle, the line is colored fuchsia, underlining a downward trend. Similarly, the EMA line is colored lime green when the closing price is above, representing an uptrend, and fuchsia when the closing price is below, indicating a downtrend.
Parameters
— Compression period: This parameter determines the lookback period used to calculate volatility compression. A higher value will take into account a longer historical period for volatility analysis, potentially capturing broader market conditions. Conversely, a smaller value focuses on more recent price movements, providing a more reactive signal to current market conditions.
— Compression multiplier: The compression multiplier is a factor applied to the Average True Range (ATR) to determine the width of Keltner channels. Increasing the multiplier widens the channel width, allowing a wider price range before a breakout is triggered. Decreasing the multiplier tightens the channels, requiring a narrower price range for a breakout signal.
— EMA period: this parameter defines the period of the exponential moving average (EMA), which acts as a trend filter. The EMA helps identify the overall market trend and provides additional confirmation of potential breakouts. Adjusting the period allows you to capture short- or long-term trends, depending on your trading preferences.
How changing parameters can be beneficial
Changing the parameters allows you to adapt the indicator to different market conditions and trading styles. Increasing the compression period can help identify broader volatility patterns and major changes in the market. On the other hand, decreasing the compression period provides more accurate and timely signals for short-term traders.
Setting the compression multiplier affects the width of the Keltner channels. Higher multipliers increase the breakout threshold, filtering out smaller price movements and providing more reliable signals during major market changes. Lower multipliers make the indicator more sensitive to smaller price ranges, generating more frequent but potentially less reliable signals.
The EMA period in the trend filter helps you align your trades with the dominant market direction. Increasing the EMA period attenuates the trend, filtering out short-term fluctuations and focusing on more sustained movements. Decreasing the EMA period allows you to react more quickly to trend changes, capturing short-term price fluctuations.
Potential drawbacks
Although the Volatility Compression Breakout indicator can provide valuable information on potential breakouts, it is important to note that no indicator guarantees accuracy or eliminates risk. False breaks and jagged movements can occur, especially in volatile or choppy market conditions. We recommend combining this indicator with other technical analysis tools, and taking fundamental factors into account to validate potential trading opportunities.
Making it work for you
To maximize the effectiveness of the Volatility Compression Breakout indicator, consider the following points:
— Combine it with other indicators: Use complementary indicators such as trend lines, oscillators or support and resistance levels to confirm signals and increase the probability of successful trades.
— Practice risk management: set appropriate stop-loss levels to protect your capital in the event of false breakouts or adverse price movements. Consider implementing trailing stops or adjusting stop-loss levels as the trade progresses.
— Validate with price action: analyze price action during the compression phase and look for signs of trend-setting momentum or weakening trends. Support your decisions by observing candlestick patterns and volume behavior during the breakout.
– Backtesting and optimization: test the indicator’s performance over different periods and market conditions. Optimize parameters based on historical data to find the most suitable settings for your trading strategy.
Remember that no single indicator can guarantee consistent profitability, and that it is essential to use the Volatility Compression Breakout indicator as part of a complete trading plan. Regularly review and adapt your strategy according to market conditions and your trading experience. Monitor the indicator’s performance and make any necessary adjustments to parameter values if market dynamics change.
By adjusting the parameters and incorporating additional analysis techniques, you can customize the indicator to suit your trading style and preferences. However, caution, thorough analysis and good risk management are essential to increase the chances of successful trading. Remember that no indicator can guarantee profits, and that continuous learning and adaptation are the key to long-term trading success.
indicator:
|
1 2 3 4 5 6 7 8 9 10 11 12 13 14 15 16 17 18 19 20 21 22 23 24 25 26 27 28 29 30 31 32 33 34 35 36 37 38 39 40 41 42 43 44 45 46 47 48 49 50 51 52 53 54 55 56 57 |
// Ce code source est soumis aux termes de la Mozilla Public License 2.0 sur https://mozilla.org/MPL/2.0/ //code traduit à partir du code original de LeafAlgo: //variables compressionPeriod=20 compressionMultiplier=1.5 emaPeriod=50 // Calculer les canaux ATR et Keltner atr =AverageTrueRange[14] keltnerMiddle = KCentre keltnerUpper = keltnerMiddle + (compressionMultiplier * atr) keltnerLower = keltnerMiddle - (compressionMultiplier * atr) KUp=KeltnerBandUp[compressionPeriod] KCentre=KeltnerBandCenter[compressionPeriod] KDown=KeltnerBandDown[compressionPeriod] // écart type stdDev = STD[compressionPeriod](close) // filtre de tendance ema = ExponentialAverage[emaPeriod](close) // Déterminer les conditions de rupture breakoutUp =(high > (keltnerUpper + stdDev)) and close > ema and close[1] <= ema[1] breakoutDown = (low < (keltnerLower - stdDev)) and close < ema and close[1] >= ema[1] // Tracer des formes de répartition if breakoutUp THEN DRAWTEXT("▲",barindex,KDown,dialog,bold,30)coloured(0,155,0) endif if breakoutDown THEN DRAWTEXT("▼",barindex,KUp,dialog,bold,30)coloured(225,0,0) endif if (close>Keltnermiddle and close<ema) or (close<Keltnermiddle and close>ema) then DRAWCANDLE(open, high, low, close)coloured(255,255,0,255) endif if close<Keltnermiddle and close<ema then DRAWCANDLE(open, high, low, close)coloured(253,63,146,255) endif //coloriage if close> Keltnermiddle then r= 255 g= 255 b= 0 else r= 253 g= 63 b= 146 endif if close> ema then r1= 255 g1= 255 b1= 0 else r1= 253 g1= 63 b1= 146 endif return keltnerUpper as "Kupper",keltnerMiddle coloured(r,g,b) as "Kmiddle",keltnerLower as "Klower",KUp as "Kup",KCentre as "KCentre",KDown as "Kdown",ema coloured(r1,g1,b1) as "ema" |
Share this
No information on this site is investment advice or a solicitation to buy or sell any financial instrument. Past performance is not indicative of future results. Trading may expose you to risk of loss greater than your deposits and is only suitable for experienced investors who have sufficient financial means to bear such risk.
ProRealTime ITF files and other attachments :
Find other exclusive trading pro-tools on ![]()
PRC is also on YouTube, subscribe to our channel for exclusive content and tutorials


correction , to have green candle add : if (close>Keltnermiddle and close>ema) or (closeema) then
DRAWCANDLE(open, high, low, close)coloured(0,255,0,255)
endif
E’ da aggiungere al codice postato?
sì da aggiungere
wie kann ich einstellen das die grünen und roten Dreiecke im Chart zu sehen sind?
ils sont visibles par défaut , ajuster la compressionPeriod pour test
auf welchen Wert muss ich die Kompresionsperiode stellen?
— Période de compression : ce paramètre détermine la période de rétrospection utilisée pour calculer la compression de la volatilité. Une valeur plus élevée prendra en compte une période historique plus longue pour l’analyse de la volatilité, capturant potentiellement des conditions de marché plus larges. À l’inverse, une valeur plus petite se concentre sur les mouvements de prix plus récents, fournissant ainsi un signal plus réactif aux conditions actuelles du marché.